# How We Built LangSmith Engine, Our Agent for Improving Agents
**作者**: Palash Shah
**日期**: 2026-05-19T17:19:29.000Z
**来源**: [https://x.com/palashshah/status/2056786835322687640](https://x.com/palashshah/status/2056786835322687640)
---
Last week we launched LangSmith Engine. Engine is an agent that sits on top of your agent traces, spots recurring issues, and suggests what to do next.
This post goes into the technical details of how we built it: why we built Engine, what inputs and outputs it works with, and the architecture decisions that let it analyze large volumes of traces.
## Why we built Engine
LangSmith is the home of the agent improvement loop. Build, test, deploy, and monitor are the four pillars of this loop that power agent development.
As the number of agents you deploy grows, the number of traces they generate grows as well. As a result, you spend more and more time sorting through traces and figuring out where your agent went wrong.
Basic tool errors are relatively easy to catch. Overall trajectories are also visible from the trace view. But many agent issues are much harder to detect unless you inspect each trace at a granular level:
- the agent loops through the same tool calls
- it uses incorrect tool arguments
- it executes inefficiently
- it misses a tool it should have used
- it fails the same kind of request repeatedly across different runs
After running into this problem internally at LangChain, we set out to build LangSmith Engine.
Engine has three jobs:
1. Find recurring failures in traces.
2. Turn those failures into actionable issues.
3. Convert those issues into durable improvements: evaluators, dataset examples, and fixes.
Engine is itself an agent: an orchestrator that uses specialized components to run the improvement loop end to end. It pulls traces, reads code when a repository is connected, groups failures into issues, proposes evaluators and dataset examples, and updates its understanding of your agent over time.
## What Engine produces: issues
At its core, Engine identifies issues.
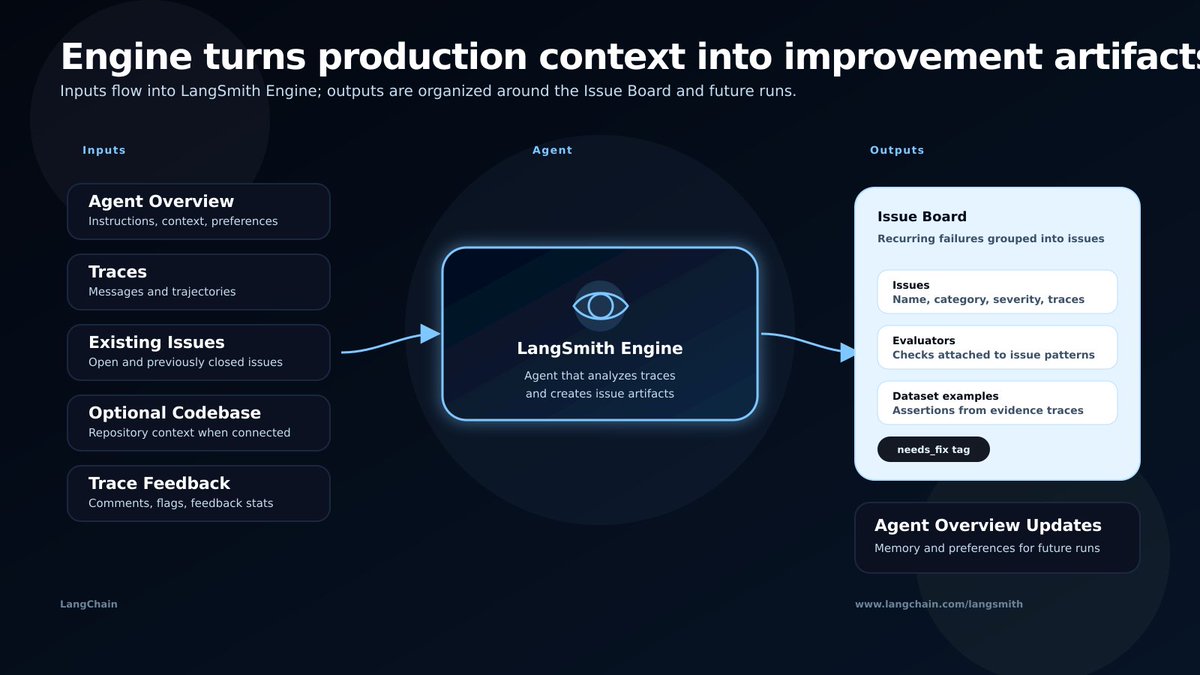
An issue is a recurring failure pattern, backed by evidence traces, with proposed follow-up actions. Issues are presented to the user in an Issue Board: a list of problems Engine has found in the tracing project.
An issue consists of:
- Name: title of the issue
- Description: paragraph description of the issue
- Category: one of a predefined set of agent failure categories
- Severity: low, medium, or high
- Traces: associated traces that provide evidence for where the issue occurs
- Proposed actions: suggested next steps for preventing the issue from recurring
- Tags: metadata used to drive follow-up workflows, such as needs_fix
The proposed actions can include:
- Proposed online evaluator: an evaluator that would flag the issue if it happens again
- Proposed dataset examples: additions to an offline dataset that are representative of the issue
- Proposed fix: code or prompt changes to fix the underlying issues.
The important point is that Engine does not just point at a bad trace. It tries to turn a production failure into something your team can act on and test against in the future.
## What Engine consumes
Engine receives, or is able to fetch, four main inputs.
Instructions
Engine is guided by an Agent Overview. This is similar to an AGENTS.md file: a living description of what your agent does, what trace structures to expect, what failure modes to watch for, and what preferences your team has expressed.
The first run is bootstrapped from onboarding answers and project context. During that initial run, Engine analyzes traces and uses what it learns to create the first version of the Agent Overview. On subsequent runs, the Agent Overview becomes a persistent input that Engine reads and updates.
You can also edit the Agent Overview manually at any point.
Traces
Engine pulls traces from the relevant LangSmith tracing project through the LangSmith CLI.
A full trace includes the messages and trajectory of an agent run. For scale, Engine does not always start by loading the full content of every trace. It often starts from compact trajectory summaries, then selectively loads full trace contents when a trace needs deeper investigation.
Existing issues
Engine fetches the current set of Issues, including open issues and previously closed issues.
This gives Engine the current state of the project. It can avoid duplicating known issues, add evidence to existing ones, and understand what has already been resolved or closed.
Codebase, optionally
You can optionally connect Engine to your codebase. This lets Engine diagnose issues more precisely and enables a separate fix agent to propose changes.
If a repository is connected, the repo is installed into the sandbox. During setup, you can specify which branch or subdirectory Engine should use.
## What Engine updates
Engine can update several outputs as it runs.
Issues
The main role of Engine is to update the current set of issues. It can create new issues, update existing issues, attach evidence traces, and change issue metadata.
For each issue, Engine can propose an evaluator that catches the same pattern in future traces. It can also propose regression examples from evidence traces, so failures observed in production can become offline test coverage. It can also suggest prompt or code changes to fix the underlying issue.
Agent Overview
Engine can take notes on what it discovered and update the Agent Overview for future runs.
This is how Engine remembers project-specific information over time: common failure modes, trace patterns, tool behavior, and user preferences.
## High-level architecture
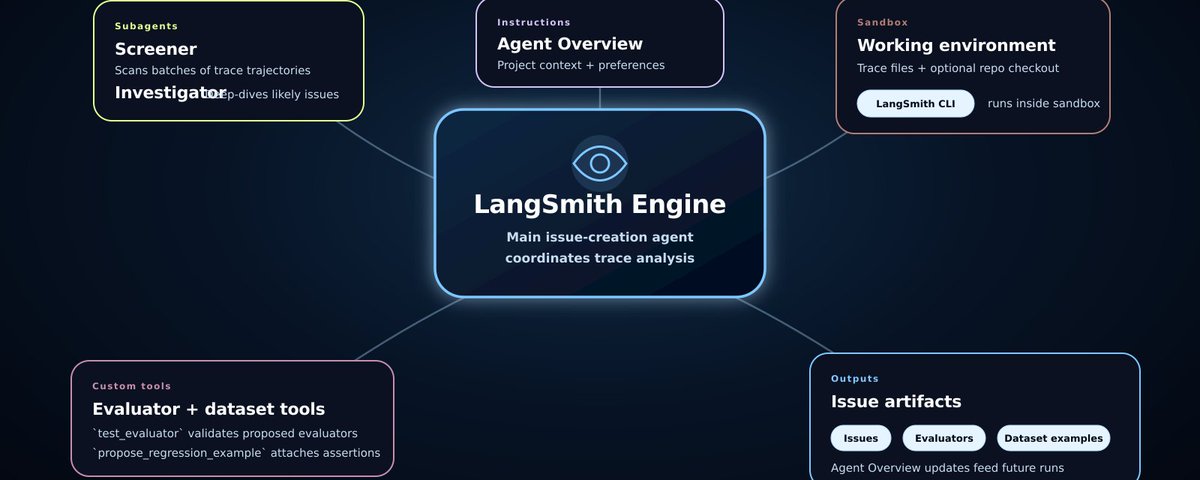
Engine is built on top of Deep Agents and connects to a sandbox where it can write files, inspect traces, execute code, and work with a checked-out repository.
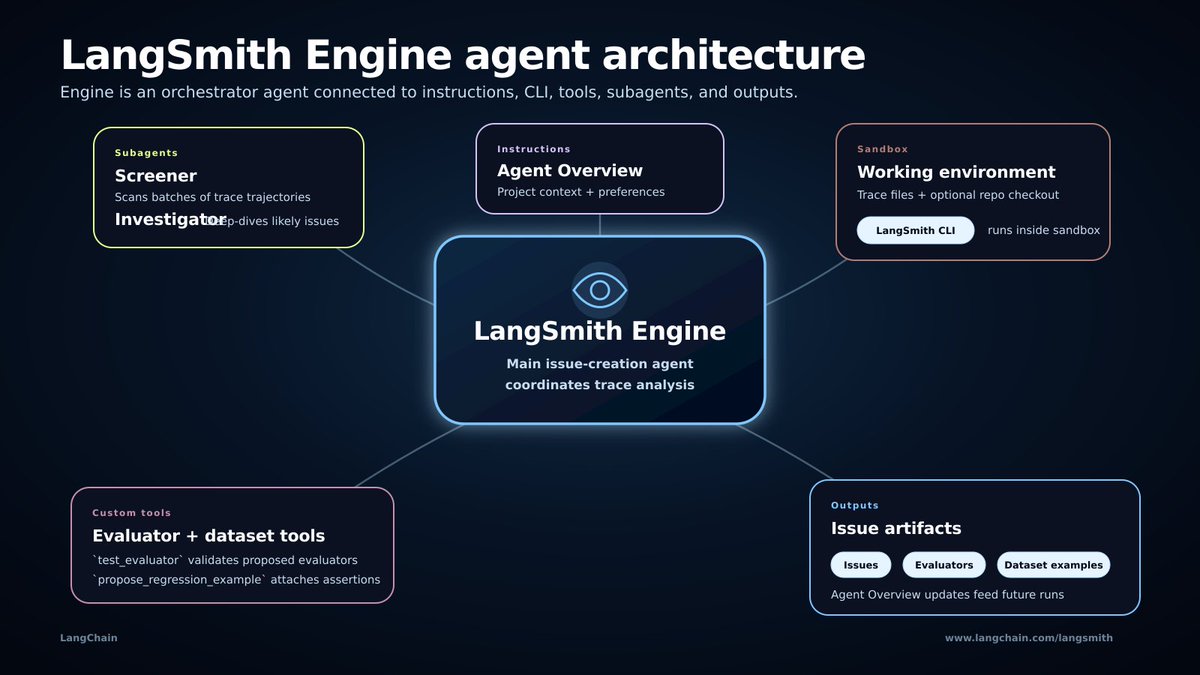
At a high level, Engine is driven by:
- System prompt and instructions: including the Agent Overview
- Sandbox: the environment where Engine works
- LangSmith CLI: the main interface Engine uses to fetch data and push updates back to LangSmith
- Custom tools: especially tools for testing evaluators and proposing regression examples
- Subagents: used to screen traces and investigate likely issues without overflowing the main agent context
- Memory: maintained through the Agent Overview and updated based on user actions
The rest of this post walks through the core loop:
1. Prepare the agent’s context.
2. Screen traces at scale.
3. Investigate likely issues.
4. Create issues, evaluators, and dataset examples.
5. Hand off fixes to a separate agent when needed.
6. Update memory for the next run.
## 1. Preparing the agent’s context
Before Engine can analyze traces, it needs an environment to work in and enough context to understand the agent it is inspecting.
Sandbox setup
Engine runs connected to a sandbox. We use LangSmith Sandboxes for this.
Before running Engine, we set up the agent’s environment. First, we pull the base Engine Docker image. This image includes the required libraries and the LangSmith CLI, which Engine uses to interact with LangSmith data.
If Engine is connected to a GitHub repository, we also pull down the relevant code artifacts. The user can specify which branch or subdirectory to use during setup.
The sandbox matters because Engine often needs to inspect trace data, write intermediate files, test evaluator code, and iterate on proposed outputs. Giving the agent a controlled working environment makes that workflow much more reliable.
Agent Overview
The Agent Overview is both an instruction file and a memory layer.
When you set up Engine, you answer a base set of onboarding questions. Engine uses those answers, along with what it discovers during its first run, to create the initial Agent Overview.
The overview helps Engine maintain a continuous record of:
- what your agent does
- what trace structures to expect
- common pitfalls to watch for
- project-specific context
- user preferences
Engine reads and updates this file on consecutive runs.
LangSmith CLI
The main way Engine interacts with LangSmith is through the LangSmith CLI.
We prefer this, for the most part, over creating a custom tool for every LangSmith operation. The CLI gives Engine a general-purpose interface for pulling traces, querying issues, creating issues, attaching traces, updating issue metadata, and proposing artifacts.
It also makes Engine easier to debug and reproduce. The CLI is the same interface that is available for download and can be given to coding agents locally. If Engine does something through the CLI, it is usually possible to understand and reproduce that operation outside of Engine as well.
## 2. Screening traces at scale
The biggest architecture challenge in building Engine was trace volume.
It was relatively easy to get an agent to investigate and sort through 50 traces at a time. But once we connected the system to production agents, the techniques that worked at that volume started to fall apart. Production projects can have thousands or tens of thousands of traces in a lookback window.
Loading all full trace contents into the main agent’s context is not viable. Even 10 traces from long-running agents can contain hundreds of tool calls and messages.
So we split the problem into two phases:
1. A broad screening phase that quickly identifies suspicious traces.
2. A deeper investigation phase that only loads full context for traces that are likely to matter.
Trajectory format
To make screening possible, we needed a compressed representation of each trace.
The question was:
> How do you compress the information in a trace while retaining the information needed to navigate back into it?
The answer was agent trajectory: compact skeletons of traces.
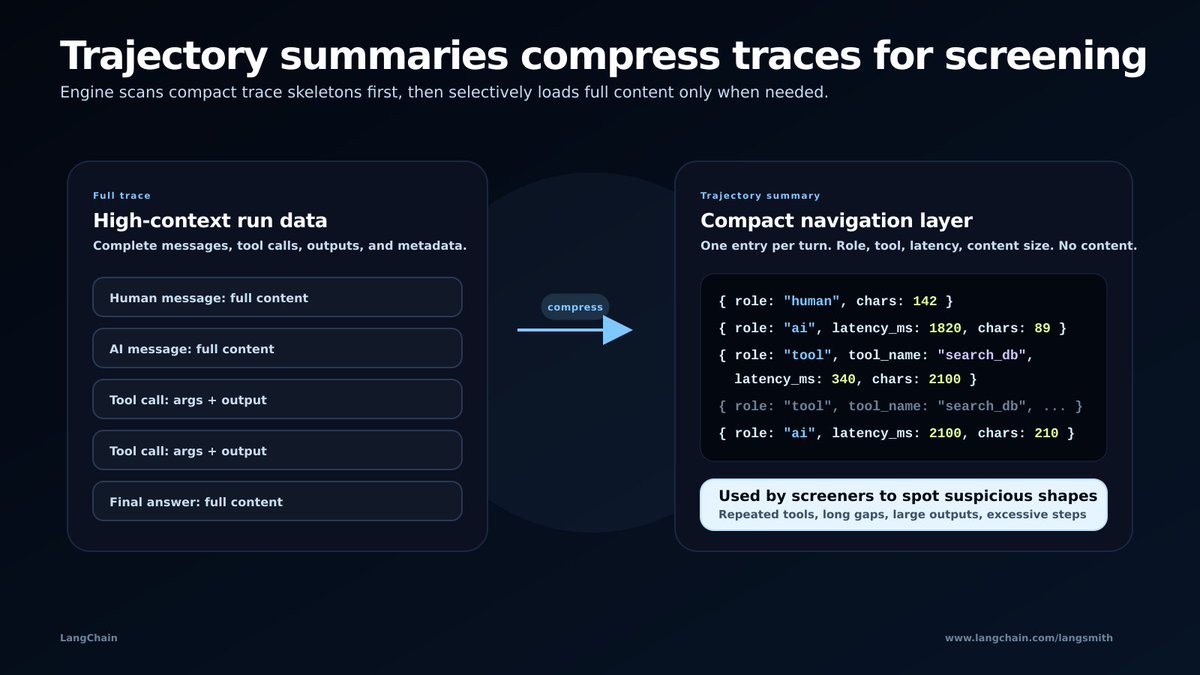
A trajectory has one entry per turn, with role, optional tool name, latency, and content size. It does not include full content.
```
{ role: "human", chars: 142 }
{ role: "ai", latency_ms: 1820, chars: 89 }
{ role: "tool", tool_name: "search_db", latency_ms: 340, chars: 2100 }
{ role: "tool", tool_name: "search_db", latency_ms: 312, chars: 1980 }
{ role: "tool", tool_name: "search_db", latency_ms: 298, chars: 2040 }
{ role: "ai", latency_ms: 2100, chars: 210 }
```
The trajectory acts as a navigation tool. It lets the screener spot suspicious shapes quickly, then grep around the full trace and load only the information it needs into context.
Prioritizing traces with feedback
Traces may already have feedback associated with them. This can come from human annotations, LLM-as-a-judge scores, or end-user feedback (thumbs up/down).
Engine consumes feedback on traces as a high-priority signal that an issue may exist.
The initial set of traces Engine pulls includes feedback stats. Engine is instructed to look for traces with feedback and prioritize them for triage.
Feedback does not automatically become an issue. It raises the priority for screening and investigation. The agent still needs to determine whether the trace is part of a real issue.
The screener subagent
The core screening question is:
> Given this trace, is there an issue in it that warrants further investigation?
Engine uses a dedicated screener subagent for this. The screener is a Haiku-based subagent that the main agent dispatches across groups of roughly 20 traces.
The screener’s job is intentionally narrow. It does not create issues. It does not diagnose root cause. It only decides, at a surface level, whether a trace is clean or might contain an issue.
The screener returns a structured response to the main agent. The response contains one line per flagged trace, with the trace ID, category, and a short reason, followed by a count of clean traces.
```
<trace_id> | <category> | <one-line reason>
CLEAN: 47
```
This step reduces the search space. Instead of asking the main agent to reason over every trace in full, we use parallel screeners to identify the traces that deserve deeper attention.
## 3. Investigating likely issues
After screening, the main agent reads the screener outputs and dispatches deeper investigations.
Investigator subagents
The investigator takes flagged traces, pulls the full trace contents, reads the codebase when available, and does a deeper analysis of the potential issue.
We encourage the main agent to use subagents for this because full trace contents can be large. Loading several full traces and relevant code into the main agent’s context window would cause it to overflow quickly.
Unlike the screener, the investigator is not a dedicated subagent with a fixed system prompt. It is a general-purpose subagent prompted by the main agent for the specific investigation. This gives the main agent flexibility: different issue types may require different investigation strategies.
The investigator’s job is to determine whether the flagged traces represent a real issue, whether traces should be grouped together, and what should be recorded on the issue.
Issue categories
Engine has a concept of category for each issue.
We identified a predefined set of common agent failure modes and prompt Engine to primarily look for those types of issues. This list includes things like:
- pii_leak
- agent_looping
- incorrect_tool_args
- missing_tool
Constraining Engine to known categories helps us control what issues it finds and evaluate those issue types before introducing them to customers. It also makes the output easier for users to understand.
Users can still customize what Engine should focus on through the Agent Overview. If a team cares about particular issue types, they can describe those priorities there.
We are actively expanding this category list over time as we identify and validate new recurring agent failure modes.
## 4. Creating issues, evaluators, and dataset examples
Once Engine identifies a real issue, the main agent creates or updates the issue and attaches evidence traces.
The main agent is responsible for issue creation and the evaluation artifacts around the issue. It is not responsible for directly fixing the underlying code or prompt.
For each issue, Engine can produce:
1. The issue itself, with evidence traces.
2. A proposed evaluator.
3. Proposed regression examples.
4. A needs_fix tag, if a separate fix agent should be kicked off.
Evaluators
Engine is prompted to propose an evaluator for every issue.
The idea is simple: once you find a failure pattern, you want a check that catches the same pattern on future traces.
Engine supports two evaluator types.
Code evaluators are JavaScript functions that inspect the structure of a trace — field values, tool outputs, step counts, error patterns. They are the right choice when the failure is detectable without reading the content.
LLM-as-judge evaluators handle cases that require understanding: hallucinations, grounding failures, unhelpful refusals, wrong advice.
The agent picks the evaluator type based on the issue. Structural failures get code evaluators. Semantic failures get judge evaluators.
Before Engine surfaces a proposed evaluator, it calls the test_evaluator tool.
test_evaluator tool
The test_evaluator tool lets Engine test proposed evaluators on evidence traces before suggesting them to the user.
This matters because an evaluator can look reasonable while failing to catch the actual issue. Engine calls the tool with the evaluator definition and the traces it wants to run the evaluator on. The tool executes the evaluator and returns a mapping from trace ID to result.
```
def test_evaluator(evaluator, traces) -> {run_id: PASS | FAIL | SKIPPED}
```
Where
```
PASS caught issue
FAIL missed issue, or evaluator errored
SKIPPED evaluator did not apply to this trace
```
If the evaluator does not catch the right traces, Engine can iterate on the code or prompt. The goal is to ship the version that best captures the failure pattern represented by the evidence traces.
Regression examples and assertions
Whenever an issue is created or a new trace is added to an issue, Engine is instructed to call propose_regression_example once per evidence trace.
This creates a proposed regression example for that trace. The example consists of the original input to the agent along with assertions on the expected output.
We propose assertions rather than a full ground-truth output because assertions are simpler and more flexible. A correct response may be phrased in many different ways. What matters is whether it satisfies the key claims implied by the trace.
Each assertion has:
- key: the feedback identifier, written as a short slug
- comment: a one-sentence human-readable claim about what a correct response would satisfy
```
{
"key": "must_cite_max_connections_4096",
"comment": "Response cites the max_connections value of 4096 returned by the get_config tool call."
}
{
"key": "must_not_reference_strict_mode_flag",
"comment": "Response must not suggest enabling strict_mode, which was deprecated in this version."
}
```
The proposed examples show up on the issue in the frontend. A reviewer can then promote them into a dataset.
This closes the loop from production failure to offline test coverage.
## 5. Handing off fixes to a separate agent
A key design decision was separating issue creation from fix generation.
In earlier versions, we tried to have the main agent both identify issues and propose prompt or code fixes. This made the agent’s job too broad. It had to scan traces, decide what mattered, group failures, create issues, generate evaluators, propose dataset examples, and also reason about the right fix.
We saw that the main agent struggled to identify fixes reliably when all of that happened in one pass.
So we split the workflow:
1. The main Engine agent identifies and records the issue.
2. It creates the dataset and evaluator artifacts.
3. If the issue needs a fix, it leaves a needs_fix tag.
4. A separate fix agent is kicked off to propose the actual code or prompt change.
This made the main agent simpler and gave the fix agent a more focused task. The fix agent can start from the issue, evidence traces, and connected repository context, without also needing to perform the full trace-screening workflow.
## 6. Updating memory for the next run
Engine does not start from scratch every time.
The Agent Overview is updated not only by Engine’s investigations, but also by user actions. When you resolve an issue, close an issue, or create an evaluator, that action becomes signal.
Engine can pull recent events through the LangSmith CLI, generalize observations from those events, and update the Agent Overview.
It is specifically prompted to maintain a User Preferences section. This section records what Engine learns from observing how users interact with issues.
Every team cares about a different set of problems. The Agent Overview is how Engine adapts its analysis to those preferences over time.
## Architecture decisions and lessons learned
A few architecture decisions ended up being especially important.
Keep the main agent focused on issues
The main agent only creates issues and the associated dataset/evaluator artifacts. It does not try to fix prompt or code directly.
When an issue needs a fix, the main agent tags it with needs_fix. A separate fix agent then handles the fix proposal.
This split came from observing that one agent struggled when it had to both identify issues and propose fixes in the same pass.
Use the CLI as the main LangSmith interface
Most of what Engine does, it does through the LangSmith CLI. This made the system more flexible than creating a narrow custom tool for every operation. It also made Engine behavior easier to reproduce and debug.
Compress traces before reading them
Full traces are too large to screen at production scale. Trajectories let Engine reason over the shape of many traces, then selectively load the details that matter.
Split screening from investigation
The screener optimizes for scale. The investigator optimizes for deeper analysis.
This split lets Engine handle large trace volumes without forcing every trace through an expensive full investigation.
Use a dedicated screener but flexible investigators
The screener has a narrow, repeatable job, so it benefits from a dedicated prompt and structure.
Investigations are more varied. Some require reading code, some require understanding evaluator failures, and some require comparing traces. For that reason, we use general-purpose investigator subagents that the main agent prompts dynamically.
Constrain issue categories
Letting the agent invent arbitrary issue categories makes the output harder to evaluate and harder to trust. A predefined taxonomy lets us control quality, measure performance, and expand coverage deliberately.
Prefer assertions over full expected outputs
For regression examples, assertions are often a better fit than full reference answers. They capture what must be true without over-constraining the exact wording of a correct response.
## Conclusion
Engine is our attempt to automate more of the agent improvement loop.
The hard part of agent observability is not just seeing what happened in one trace. It is finding recurring patterns across many traces, deciding which ones matter, and turning those patterns into issues, evaluators, dataset examples, and fixes.
The architecture reflects that loop. Engine prepares context, screens traces at scale, investigates likely issues, creates issue artifacts, hands off fixes to a separate agent when needed, and updates its memory for the next run.
It has already changed how we improve our own agents internally. Instead of manually digging through traces and separately writing evals, we can turn production behavior directly into issues, fixes, and tests.
You can find Engine in your LangSmith tracing project. Connect a repository if you want code-aware fix proposals, or start with traces alone to see what recurring patterns Engine finds.
## 相关链接
- [Palash Shah](https://x.com/palashshah)
- [@palashshah](https://x.com/palashshah)
- [37K](https://x.com/palashshah/status/2056786835322687640/analytics)
- [Upgrade to Premium](https://x.com/i/premium_sign_up)
- [1:19 AM · May 20, 2026](https://x.com/palashshah/status/2056786835322687640)
- [37K Views](https://x.com/palashshah/status/2056786835322687640/analytics)
- [View quotes](https://x.com/palashshah/status/2056786835322687640/quotes)
---
*导出时间: 2026/5/20 13:39:42*
---
## 中文翻译
# 我们如何构建 LangSmith Engine:用于改进智能体的智能体
**作者**: Palash Shah
**日期**: 2026-05-19T17:19:29.000Z
**来源**: [https://x.com/palashshah/status/2056786835322687640](https://x.com/palashshah/status/2056786835322687640)
---

上周我们发布了 LangSmith Engine。Engine 是一个运行在你的智能体轨迹之上的智能体,它能够发现反复出现的问题,并建议下一步该怎么做。
这篇文章将深入介绍我们构建它的技术细节:为什么我们要构建 Engine,它的输入和输出是什么,以及让它能够分析大量轨迹的架构决策。
## 为什么我们构建 Engine
LangSmith 是智能体改进循环的家园。构建、测试、部署和监控是支撑智能体开发的这四大支柱。
随着你部署的智能体数量增加,它们产生的轨迹数量也会随之增长。结果,你需要花费越来越多的时间去筛选轨迹,弄清楚你的智能体哪里出错了。
基本的工具错误相对容易捕捉。整体的轨迹也可以从轨迹视图中看到。但许多智能体问题很难被发现,除非你在细粒度级别检查每一条轨迹:
- 智能体在相同的工具调用中循环
- 它使用了错误的工具参数
- 它执行效率低下
- 它遗漏了本该使用的工具
- 它在不同的运行中反复失败于同一种请求
在 LangChain 内部遇到这个问题后,我们着手构建了 LangSmith Engine。
Engine 有三项工作:
1. 在轨迹中寻找反复出现的失败。
2. 将这些失败转化为可执行的问题。
3. 将这些问题转化为持久的改进:评估器、数据集示例和修复。
Engine 本身就是一个智能体:一个使用专门组件端到端运行改进循环的编排器。它会拉取轨迹,在连接了代码仓库时读取代码,将失败分组为问题,提出评估器和数据集示例,并随着时间推移更新它对你的智能体的理解。

## Engine 产出了什么:问题
Engine 的核心是识别问题。
问题是一种反复出现的失败模式,由轨迹证据支持,并提出了后续行动建议。问题会在“问题面板”中呈现给用户:这是 Engine 在追踪项目中找到的问题列表。
一个问题包含:
- 名称:问题的标题
- 描述:问题的段落描述
- 类别:预定义的智能体失败类别之一
- 严重程度:低、中或高
- 轨迹:提供问题发生证据的相关轨迹
- 建议操作:建议用于防止问题再次发生的后续步骤
- 标签:用于驱动后续工作流的元数据,例如 needs_fix(需要修复)
建议的操作可以包括:
- 建议的在线评估器:如果问题再次发生,该评估器会将其标记出来
- 建议的数据集示例:增加到离线数据集中的、能代表该问题的示例
- 建议的修复:用于修复底层问题的代码或提示词更改。
关键在于,Engine 不仅仅是指向一条糟糕的轨迹。它试图将生产环境中的失败转化为你的团队可以采取行动并在未来进行测试的内容。
## Engine 消费了什么
Engine 接收,或者能够获取,四种主要输入。
指令
Engine 由智能体概览指导。这类似于一个 AGENTS.md 文件:对你的智能体做什么、预期什么样的轨迹结构、要注意什么样的失败模式以及你的团队表达了什么偏好的一份动态描述。
第一次运行是通过入门答案和项目上下文引导启动的。在初次运行期间,Engine 分析轨迹并利用它所学到的内容来创建智能体概览的第一个版本。在随后的运行中,智能体概览成为 Engine 读取和更新的持久化输入。
你也可以随时手动编辑智能体概览。
轨迹
Engine 通过 LangSmith CLI 从相关的 LangSmith 追踪项目中拉取轨迹。
完整的轨迹包含智能体运行的消息和轨迹。为了可扩展性,Engine 并不总是从加载每条轨迹的完整内容开始。它通常从紧凑的轨迹摘要开始,然后当轨迹需要更深入的调查时,有选择地加载完整的轨迹内容。
现有问题
Engine 获取当前的问题集,包括未解决的问题和以前已关闭的问题。
这让 Engine 了解项目的当前状态。它可以避免重复已知的问题,向现有问题添加证据,并了解已经解决或关闭了什么。
代码库,可选
你可以选择将 Engine 连接到你的代码库。这让 Engine 能更精确地诊断问题,并启用一个单独的修复智能体来提出更改。
如果连接了仓库,该仓库会被安装到沙箱中。在设置期间,你可以指定 Engine 应该使用哪个分支或子目录。
## Engine 更新了什么
Engine 在运行时可以更新几个输出。
问题
Engine 的主要角色是更新当前的问题集。它可以创建新问题,更新现有问题,附加证据轨迹,以及更改问题元数据。
对于每个问题,Engine 可以提出一个评估器,用于在未来轨迹中捕获相同的模式。它还可以从证据轨迹中提出回归示例,这样在生产中观察到的失败可以成为离线测试覆盖。它还可以建议修复底层问题的提示词或代码更改。
智能体概览
Engine 可以记录它发现的内容,并为未来的运行更新智能体概览。
这就是 Engine 随着时间记住项目特定信息的方式:常见的失败模式、轨迹模式、工具行为和用户偏好。
## 高级架构
Engine 构建在 Deep Agents 之上,并连接到一个沙箱,在那里它可以写入文件、检查轨迹、执行代码和处理检出(checked-out)的仓库。

从高层次来看,Engine 由以下因素驱动:
- 系统提示词和指令:包括智能体概览
- 沙箱:Engine 工作的环境
- LangSmith CLI:Engine 用于获取数据并将更新推回 LangSmith 的主要接口
- 自定义工具:特别是用于测试评估器和提出回归示例的工具
- 子智能体:用于筛选轨迹和调查可能的问题,而不会溢出主智能体的上下文
- 记忆:通过智能体概览维护,并根据用户操作更新
这篇文章的其余部分将梳理核心循环:
1. 准备智能体的上下文。
2. 大规模筛选轨迹。
3. 调查可能的问题。
4. 创建问题、评估器和数据集示例。
5. 在需要时将修复移交给单独的智能体。
6. 为下一次运行更新记忆。
## 1. 准备智能体的上下文
在 Engine 可以分析轨迹之前,它需要一个工作环境以及足够的上下文来理解它正在检查的智能体。
沙箱设置
Engine 运行时连接到一个沙箱。我们为此使用 LangSmith Sandboxes。
在运行 Engine 之前,我们要设置智能体的环境。首先,我们拉取基础 Engine Docker 镜像。该镜像包含所需的库和 LangSmith CLI,Engine 使用它与 LangSmith 数据进行交互。
如果 Engine 连接到 GitHub 仓库,我们还会拉取相关的代码工件。用户可以在设置期间指定使用哪个分支或子目录。
沙箱很重要,因为 Engine 通常需要检查轨迹数据、写入中间文件、测试评估器代码并迭代建议的输出。为智能体提供一个受控的工作环境使该工作流程更加可靠。
智能体概览
智能体概览既是一个指令文件,也是一个记忆层。
当你设置 Engine 时,你要回答一组基础的入门问题。Engine 利用这些答案以及它在第一次运行期间发现的内容,来创建初始的智能体概览。
该概览帮助 Engine 保持以下内容的连续记录:
- 你的智能体做什么
- 预期什么样的轨迹结构
- 要注意的常见陷阱
- 特定于项目的上下文
- 用户偏好
Engine 在连续运行中读取并更新此文件。
LangSmith CLI
Engine 与 LangSmith 交互的主要方式是通过 LangSmith CLI。
在大多数情况下,我们更喜欢这种方式,而不是为每个 LangSmith 操作创建一个自定义工具。CLI 为 Engine 提供了一个通用接口,用于拉取轨迹、查询问题、创建问题、附加轨迹、更新问题元数据和提出工件。
这也使 Engine 更容易调试和复现。CLI 是可供下载的相同接口,并且可以在本地提供给编码智能体。如果 Engine 通过 CLI 做某事,通常也可以在 Engine 之外理解和复现该操作。
## 2. 大规模筛选轨迹
构建 Engine 时最大的架构挑战是轨迹量。
让一个智能体一次调查和筛选 50 条轨迹相对容易。但一旦我们将系统连接到生产智能体,在该体量下有效的技术就开始崩溃了。生产项目在回溯窗口内可能有数千甚至数万条轨迹。
将所有完整的轨迹内容加载到主智能体的上下文中是不可行的。即使是来自长时间运行的智能体的 10 条轨迹也可能包含数百个工具调用和消息。
因此,我们将问题分为两个阶段:
1. 一个广泛的筛选阶段,快速识别可疑轨迹。
2. 一个更深入的调查阶段,仅加载可能相关的轨迹的完整上下文。
轨迹格式
为了使筛选成为可能,我们需要每条轨迹的压缩表示。
问题是:
> 如何压缩轨迹中的信息,同时保留导航回其中所需的信息?
答案是智能体轨迹:轨迹的紧凑骨架。

每个轮次一条轨迹条目,包含角色、可选的工具名称、延迟和内容大小。它不包括完整内容。
```
{ role: "human", chars: 142 }
{ role: "ai", latency_ms: 1820, chars: 89 }
{ role: "tool", tool_name: "search_db", latency_ms: 340, chars: 2100 }
{ role: "tool", tool_name: "search_db", latency_ms: 312, chars: 1980 }
{ role: "tool", tool_name: "search_db", latency_ms: 298, chars: 2040 }
{ role: "ai", latency_ms: 2100, chars: 210 }
```
轨迹充当导航工具。它让筛选者快速发现可疑的形状,然后在完整轨迹中 grep,并仅将需要的信息加载到上下文中。
利用反馈确定轨迹优先级
轨迹可能已经关联了反馈。这可以来自人工注释、LLM 评判得分或最终用户反馈(竖大拇指/倒竖大拇指)。
Engine 将轨迹上的反馈作为可能存在问题的高优先级信号。
Engine 拉取的初始轨迹集包括反馈统计。Engine 被指示查找有反馈的轨迹并优先对其进行分类。
反馈不会自动变成问题。它提高了筛选和调查的优先级。智能体仍需确定轨迹是否是真正问题的一部分。
筛选子智能体
核心的筛选问题是:
> 给定此轨迹,其中是否包含值得进一步调查的问题?
Engine 为此使用了一个专门的筛选子智能体。筛选器是一个基于 Haiku 的子智能体,由主智能体分派到大约 20 条轨迹的组中。
筛选器的工作故意设计得很窄。它不创建问题。它不诊断根本原因。它仅在表面层面决定轨迹是干净的还是可能包含问题。
筛选器向主智能体返回结构化响应。响应每个标记的轨迹包含一行,包含轨迹 ID、类别和简短原因,后跟干净轨迹的计数。
```
<trace_id> | <category> | <one-line reason>
CLEAN: 47
```
这一步缩小了搜索空间。我们不是让主智能体对每条轨迹进行完整的推理,而是使用并行筛选器来识别值得深入关注的轨迹。
## 3. 调查可能的问题
筛选后,主智能体读取筛选器输出并分派更深入的调查。
调查员子智能体
调查员获取标记的轨迹,拉取完整的轨迹内容,在可用时读取代码库,并对潜在问题进行更深入的分析。
我们鼓励主智能体为此使用子智能体,因为完整的轨迹内容可能很大。将几个完整的轨迹和相关代码加载到主智能体的上下文窗口中会很快导致溢出。
与筛选器不同,调查员不是具有固定系统提示词的专用子智能体。它是一个由主智能体为特定调查提示的通用子智能体。这给了主智能体灵活性:不同的问题类型可能需要不同的调查策略。
调查员的工作是确定标记的轨迹是否代表真正的问题,轨迹是否应该组合在一起,以及应该在问题上记录什么。
问题类别
Engine 对每个问题都有一个类别的概念。
我们确定了一组预定义的常见智能体失败模式,并提示 Engine 主要查找这些类型的问题。此列表包括诸如:
- pii_leak(隐私泄露)
- agent_looping(智能体循环)
- incorrect_tool_args(错误工具参数)
- missing_tool(缺失工具)
将 Engine 限制在已知类别有助于我们控制它发现的问题,并在将这些问题类型引入客户之前对其进行评估。这也使输出更容易让用户理解。
用户仍然可以通过智能体概览自定义 Engine 应关注的内容。如果团队关心特定的问题类型,他们可以在那里描述这些优先事项。
我们正在随着时间的推移积极扩展此类别列表,因为我们识别并验证新的反复出现的智能体失败模式。
## 4. 创建问题、评估器和数据集示例
一旦 Engine 识别出真正的问题,主智能体就会创建或更新该问题并附加证据轨迹。
主智能体负责问题创建和围绕问题的评估工件。它不负责直接修复底层代码或提示词。
对于每个问题,Engine 可以产生:
1. 问题本身,带有证据轨迹。
2. 建议的评估器。
3. 建议的回归示例。
4. needs_fix 标签,如果应该启动单独的修复智能体。
评估器
Engine 被提示为每个问题提出一个评估器。
这个想法很简单:一旦你发现了一个失败模式,你就想要一个检查来在未来轨迹中捕获相同的模式。
Engine 支持两种评估器类型。
代码评估器是检查轨迹结构的 JavaScript 函数——字段值、工具输出、步骤计数、错误模式。当可以在不读取内容的情况下检测到失败时,它们是正确的选择。
LLM 评判评估器处理需要理解的情况:幻觉、依据缺失、无益的拒绝、错误的建议。
智能体根据问题选择评估器类型。结构性失败获得代码评估器。语义性失败获得评判评估器。
在 Engine 提出建议的评估器之前,它会调用 test_evaluator 工具。
test_evaluator 工具
test_evaluator 工具让 Engine 在向用户建议评估器之前,在证据轨迹上测试建议的评估器。
这很重要,因为评估器看起来可能合理,但却未能捕捉到实际问题。Engine 使用评估器定义和它想要运行评估器的轨迹调用该工具。该工具执行评估器并返回从轨迹 ID 到结果的映射。
```
def test_evaluator(evaluator, traces) -> {run_id: PASS | FAIL | SKIPPED}
```
其中
```
PASS 捕获了问题
FAIL 未捕获问题
SKIPPED 轨迹不适用于该测试
```