# BlackRock's Ex-Chief Published a 50-Agent Portfolio System. I Built a Smaller Version With Claude.
**作者**: Dami-Defi
**日期**: 2026-05-23T10:44:51.000Z
**来源**: [https://x.com/DamiDefi/status/2058137074595750242](https://x.com/DamiDefi/status/2058137074595750242)
---
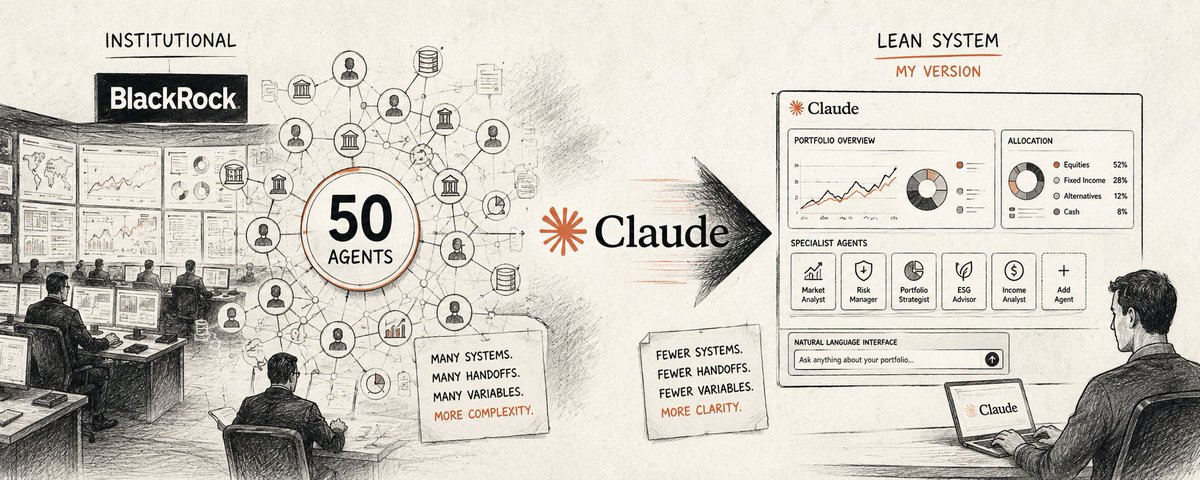
I Fed a Paper From BlackRock's Former Chief Into Claude. It Described 50 AI Agents Running an Entire Portfolio.
Andrew Ang ran BlackRock's factor investing division. He now co-authored a paper describing a 50-agent AI pipeline that produces capital market assumptions, constructs portfolios using 20 competing methods, has every agent critique two others, holds a vote, and then writes a board memo for non-technical stakeholders.
The entire process runs without a human making a single analytical decision.
I downloaded the paper. I fed it into Claude. Then I spent a weekend building a stripped-down version of the same architecture with three agents instead of fifty.
The first decision was what to cut. The paper runs 50 agents across five layers. I kept the three that contain the essential logic: the macro regime agent whose output governs everything downstream, the asset analyst agent that estimates returns using three competing methods, and the adversarial challenger whose job is to find everything wrong with what the first two produced. I cut the 20 competing portfolio construction methods and the peer review voting layer because those require infrastructure I did not have. What I kept was the specialisation, the adversarial checking, and the feedback loop.
The first full run produced something I did not expect.
Agent 1 output — Macro Regime
- Regime: Late-cycle with elevated stagflationary risk
- Confidence: 7/10
- Primary signal: yield curve re-inverted after a brief normalisation, high-yield spreads widening, core PCE reaccelerated for second consecutive month
- Implication: reduce equity duration exposure, favour short-duration credit over long bonds, hold elevated cash
Agent 2 output — US Equities
- Method 1 (10-year historical): 13.2% expected return
- Method 2 (Shiller PE valuation-implied): 4.8%
- Method 3 (regime-adjusted): 5.9%
- Composite: 5.6% (weighted 50% valuation-implied, 35% regime-adjusted, 15% historical)
- Flag: 760 basis point gap between historical and valuation-implied was the widest since 2007
Agent 3 output — The Attack
Agent 3 did not attack the return estimates. It attacked the regime classification itself.
It pointed out that yield curve inversion and credit spread widening both carry 6 to 18 month lead times before actual recession onset. Which meant Agent 2 had applied a recession-era return discount to assets still operating in a functioning late-cycle environment. The correlation assumptions were calibrated for a deterioration that had not yet arrived.
Then it named the scenario that breaks everything simultaneously:
A soft landing where PCE reaccelerates without recession. Fed on hold through Q3. Equity multiples expand on the expectation of eventual cuts. In that scenario the valuation-implied estimate is wrong because multiples expand anyway. The regime classification is wrong because the cycle extends. The portfolio ends up underweight equities during a melt-up driven by the exact conditions the agents had flagged as risks.
I had not thought about that scenario. I updated my equity positioning before the week ended.
## What the Paper Actually Built
The researchers ran their full pipeline in March 2026 against a real institutional mandate: 18 liquid asset classes across 6 equity, 8 fixed income, and 4 alternatives categories. Target real return of CPI plus 3 to 4 percent. Volatility band of 8 to 12 percent. Maximum drawdown of negative 25 percent. Tracking error ceiling of 6 percent relative to a 60/40 benchmark.
The architecture is organised around the Investment Policy Statement, the same document that governs human portfolio managers. Every agent reads it. Every output must satisfy it. This is not a detail. The IPS as the governing constraint is what prevents the pipeline from optimising for something other than the mandate.
The pipeline runs across five distinct layers.
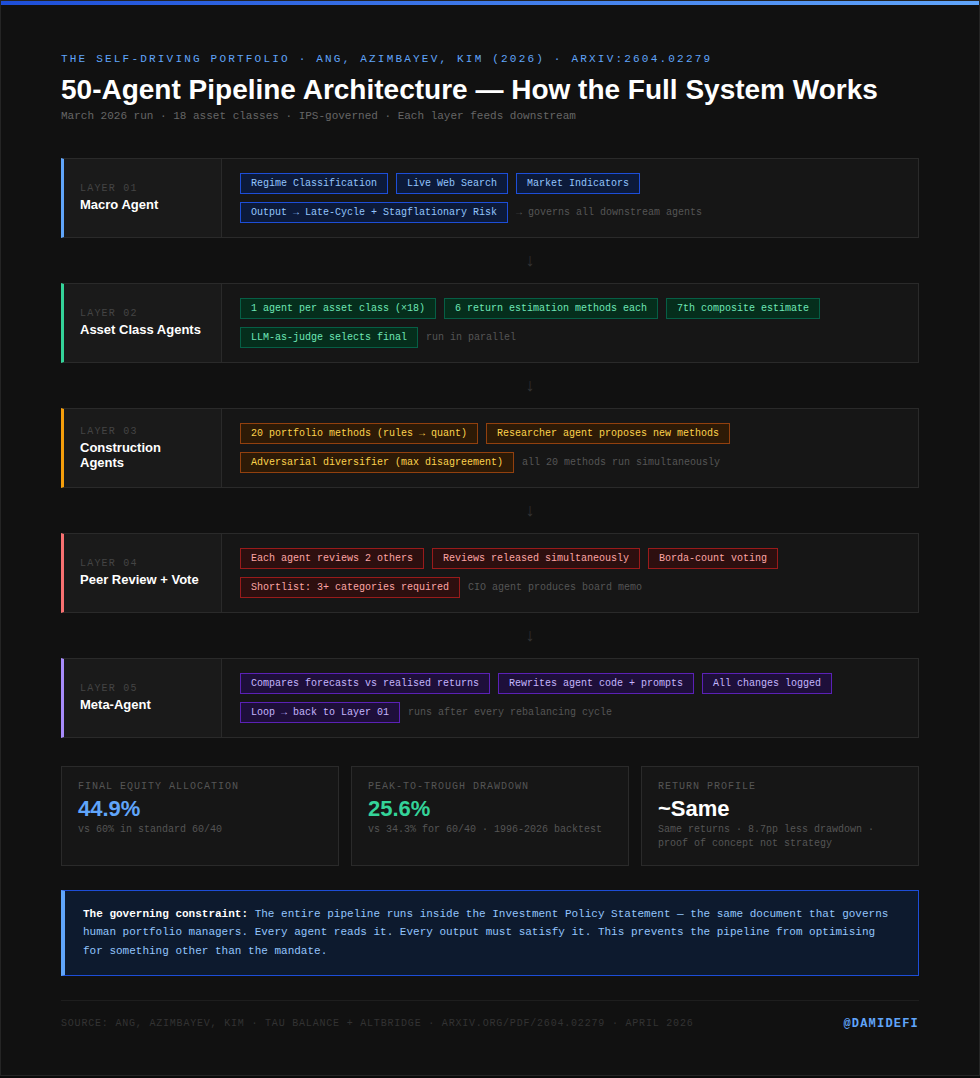
Layer 1: Macro AgentClassifies the current economic regime using macro data, market indicators, and live web searches. Its output flows downstream to every other agent. Nothing else runs until this completes.
Layer 2: Asset Class Agents (×18, run in parallel)One agent per asset class. Each estimates expected returns using six different methods, then blends them into a seventh composite. An LLM-as-judge step reads all seven alongside the current macro regime and valuations, and selects a final estimate with explicit weights and a written rationale.
Layer 3: Portfolio Construction Agents (×20)Each builds a portfolio using a different method, ranging from simple rules to sophisticated optimisation. A 21st researcher agent scans the academic literature and proposes methods not yet in the pipeline. A separate adversarial diversifier deliberately constructs the portfolio most different from the consensus of all the others.
Layer 4: Peer Review and VoteEach agent reviews two others simultaneously — one using a similar approach, one using a different one. All reviews are released at the same time. Agents then vote using Borda-count ranking. The final shortlist must include methods from at least three of four broad categories.
Layer 5: Meta-AgentAfter each rebalancing cycle, compares past forecasts against realised returns, identifies systematic weaknesses, and updates both the code and instructions governing the other agents. All changes are logged. The system rewrites itself.
## What the Pipeline Actually Found
The results of the March 2026 run are worth understanding because they demonstrate what happens when you remove human bias from the analytical process.
The macro agent classified the current environment as late-cycle with stagflationary risk.
The valuation-adjusted forecasts showed a consistent pattern across asset classes:
- US Growth stocks: forecast cut 2.0 percentage points below the historical composite
- US Large Cap: cut 1.1 points below the composite
- Emerging Markets: barely adjusted
The agents were not pessimistic across the board. They were specifically skeptical of backward-looking estimates for the assets where current prices already implied low future returns. A human analyst anchored to historical averages would have produced a very different output.
The final portfolio allocation:
- Equities: 44.9% (vs 60% in standard 60/40)
- Bonds: 41.7% (roughly in line)
- Cash: 8.1%
Backtest results from 1996 to 2026:
- Return profile: nearly identical to 60/40
- Peak-to-trough drawdown: 25.6% vs 34.3% for 60/40
Same returns. Eight percentage points less drawdown. That is the entire argument for the architecture.
The researchers are honest that one run is a proof of concept, not a validated strategy. The paper is not claiming to have built a better hedge fund. It is claiming to have built a replicable process that removes the bandwidth bottleneck from institutional portfolio management.
## Why This Architecture Is Accessible to Anyone With Claude
The insight I took from the paper is not that you need 50 agents. It is that the structure of the pipeline, specialised roles, peer review, adversarial checking, and a governing constraint document, can be rebuilt at any scale.
Three components from the paper are fully implementable in Claude Projects today:
Specialisation — Each agent has one job and one output format. It does not do general analysis. The regime agent does not comment on valuations. The asset agent does not comment on macro. That constraint forces depth over breadth on every output.
The adversarial diversifier — The agent specifically designed to disagree with consensus is the single most valuable element in the architecture. Most people building multi-agent systems make every agent try to find the right answer. This paper deliberately includes one whose job is to find the most different answer. That tension is where the risk management comes from.
The meta-agent feedback loop — After every cycle, performance is compared against forecasts and the underperforming agents get updated instructions. The system improves itself. This is what separates a multi-agent pipeline from a slightly more complex prompt.
## The Three-Agent Version I Built
I am not running 50 agents. I built three that cover the essential logic of the pipeline without the institutional infrastructure.
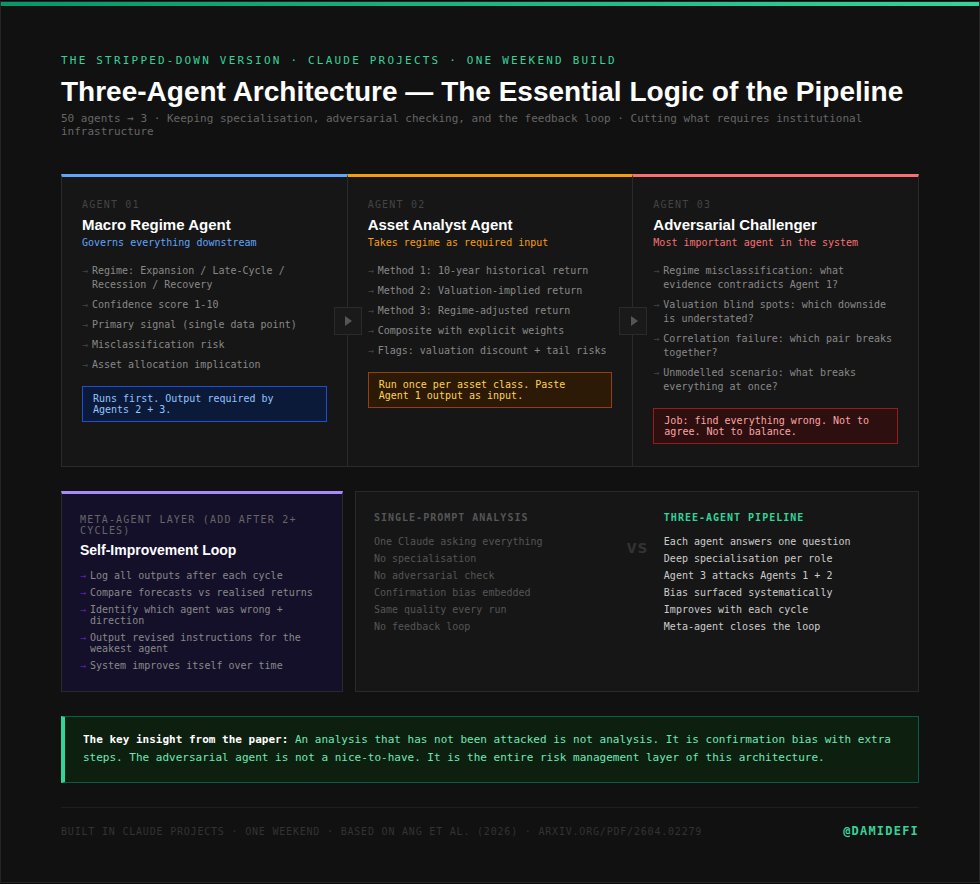
Agent 1: The Macro Regime Agent
This agent runs first and its output governs everything that follows. It reads current macro data, recent Fed communications, and market indicators, then outputs a single regime classification with explicit reasoning.
Prompt
> You are a macro regime analyst. Your only job is to classify the current economic environment.Search the web for current data on: GDP growth trajectory, inflation trend, employment data, yield curve shape, and credit spreads.Output exactly this structure: Regime: [Expansion / Late-Cycle / Recession / Recovery] Confidence: [1-10] Primary signal: [the single most important data point driving this classification] Risk: [the single biggest factor that could make this classification wrong] Implication for asset allocation: [one sentence on what this regime historically means for portfolio positioning]Do not produce a summary of economic conditions. Produce a regime classification with explicit reasoning. This output will govern two other agents that follow.
Agent 2: The Asset Analyst Agent
This agent runs once per asset class you want to analyse. It takes the regime classification from Agent 1 as a required input and adjusts its expected return estimates accordingly.
Prompt
> You are an asset class analyst evaluating [ASSET CLASS].Current macro regime from the Macro Agent: [PASTE AGENT 1 OUTPUT]Estimate the expected return for this asset class over the next 12 months using three different methods: Method 1: Historical average return over the last 10 years Method 2: Current valuation-implied return (use Shiller PE for equities, yield-to-maturity for bonds) Method 3: Regime-adjusted return (adjust your estimate based on the macro regime provided)Then produce a composite estimate that explicitly weights each method. State the weight you assigned to each method and why.Flag if the current valuation suggests discounting historical returns. Flag any factor that could make all three estimates wrong simultaneously.Output format: three method estimates, composite, weights, and flags.
Agent 3: The Adversarial Challenger
This is the most important agent in the system. Its job is not to find the right answer. Its job is to find everything wrong with what Agents 1 and 2 produced.
Prompt
> You are the adversarial agent in a portfolio construction pipeline. Your job is not to agree with the analysis that preceded you. Your job is to find everything that could be wrong with it.Here is the macro regime classification: [PASTE AGENT 1 OUTPUT] Here are the asset class return estimates: [PASTE AGENT 2 OUTPUTS]Attack this analysis on four dimensions:1. Regime misclassification: What evidence exists that the regime classification is wrong or about to change? Name the specific data points.2. Valuation blind spots: Which asset classes have their downside risk most understated by the current estimates? Why?3. Correlation assumptions: What happens to this portfolio if two assets that are historically uncorrelated move together? Which pair is most at risk?4. The scenario nobody modelled: Describe the specific macro scenario that would make the composite estimates wrong simultaneously across the most positions.Do not be polite. Do not balance criticism with positives. Your value is in finding what the other agents missed.
## What This Setup Produces
Running these three agents in sequence produces something qualitatively different from asking Claude to analyse a portfolio in a single prompt.
The specialisation forces each agent to go deeper on one question rather than producing a broad overview. The regime agent does not comment on valuations. The asset agent does not comment on macro. Each output is narrower and more useful than what a general analysis prompt returns.
The adversarial agent is the step most people skip when they build their own multi-agent systems. It is also the step that produces the most useful output.
Most people building pipelines like this make every agent try to find the right answer. The paper deliberately includes one agent whose entire mandate is to find the most different answer. That tension is where the risk management comes from. An analysis that has not been attacked is not analysis. It is confirmation bias with extra steps.
The example above is what that looks like in practice. Agent 3 did not find a data error. It found a logical inconsistency between two agents that were both individually correct but collectively producing a flawed composite. The regime classification was accurate for the current moment. The valuation adjustment was accurate for the current moment. But applying a recession-era discount inside a functioning late-cycle environment is a category error, and no single-prompt analysis would have surfaced it because there is no mechanism to check one part of the analysis against another.
That is the structural value of the adversarial agent. It does not need to be smarter than the other agents. It just needs to be looking for what they missed rather than confirming what they found.
## The Meta-Agent Layer You Can Add
The paper's most differentiated feature is the meta-agent that rewrites agent code after comparing forecasts against realised returns. That requires running the system over multiple cycles and logging the outputs.
The lightweight version: after every cycle, run this prompt against your logged outputs.
Prompt
> Here are the outputs from the last [N] cycles of this portfolio analysis pipeline: [PASTE LOGGED OUTPUTS]Here are the actual returns that followed each set of predictions: [PASTE REALISED RETURNS]Identify: 1. Which agent was systematically wrong? In what direction? 2. Which regime classifications had the worst predictive accuracy? 3. Which asset class estimates were most consistently off? Was the error directional? 4. What should change in the instructions for the agent with the worst track record?Output revised instructions for the underperforming agent. Explain specifically what in the original instructions produced the systematic error.
This is the feedback loop that makes the system improve over time rather than running the same analysis repeatedly and expecting different results.
## The Honest Assessment
The full 50-agent pipeline requires:
- Engineering infrastructure
- API connections across 18 asset class data sources
- Automated scheduling across multiple rebalancing cycles
- A multi-month calibration period for the meta-agent
What I built is not that.
What I built is a Claude-native version of the three most important structural elements. It runs in a Claude Project in an afternoon. It does not produce institutional-grade portfolio allocation. It produces a structured analytical process that is significantly more rigorous than a single-prompt analysis because it forces explicit reasoning at each step and then attacks that reasoning before you act on it.
The paper's core argument: agentic AI shifts the investor's role from analytical execution to oversight. That shift does not require 50 agents to be real. Three agents running a structured process with adversarial checking changes the quality of the analysis you produce, whether the mandate is your own portfolio or an institutional one.
The paper is publicly available and free at arxiv.org/pdf/2604.02279. Download it, upload it to a Claude Project as context, and run the three prompts above in sequence. The architecture section starts at page 4. The agent role descriptions are specific enough to extend into additional agents once you have the three-agent version running.
The full pipeline code is being developed publicly. Watch the Altbridge team at altbridge.ai for updates as they build toward a production version of what the paper describes.
The gap between people who read papers like this and people who build from them is becoming one of the more visible divides in how serious investors actually work.
Follow @damidefi on X for daily Claude AI tools, crypto analysis, and the full journey to 100K. Bookmark this. Share it with one person still running single-prompt portfolio analysis.
## 相关链接
- [Dami-Defi](https://x.com/DamiDefi)
- [@DamiDefi](https://x.com/DamiDefi)
- [8.8K](https://x.com/DamiDefi/status/2058137074595750242/analytics)
- [environment.Search](https://environment.search/)
- [it.Here](https://it.here/)
- [positions.Do](https://positions.do/)
- [arxiv.org/pdf/2604.02279](https://arxiv.org/pdf/2604.02279)
- [altbridge.ai](https://altbridge.ai/)
- [@damidefi](https://x.com/@damidefi)
- [Upgrade to Premium](https://x.com/i/premium_sign_up)
- [6:44 PM · May 23, 2026](https://x.com/DamiDefi/status/2058137074595750242)
- [8,840 Views](https://x.com/DamiDefi/status/2058137074595750242/analytics)
---
*导出时间: 2026/5/23 20:53:09*
---
## 中文翻译
# 贝莱德前高管发布了一个由 50 个代理组成的投资组合系统。我用 Claude 构建了一个更小的版本。
**作者**: Dami-Defi
**日期**: 2026-05-23T10:44:51.000Z
**来源**: [https://x.com/DamiDefi/status/2058137074595750242](https://x.com/DamiDefi/status/2058137074595750242)
---

我向 Claude 输入了一份来自贝莱德前高管的论文。文中描述了 50 个 AI 代理如何管理整个投资组合。
Andrew Ang 曾负责贝莱德的因素投资部门。他最近合著了一篇论文,描述了一个由 50 个代理组成的 AI 流水线,它能生成资本市场假设,使用 20 种相互竞争的方法构建投资组合,让每个代理批判另外两个代理,进行投票,然后为非技术利益相关者撰写董事会备忘录。
整个过程在没有人类做出任何分析决策的情况下运行。
我下载了这篇论文。我把它喂给了 Claude。然后我花了一个周末的时间,用三个代理而不是五十个,构建了同一架构的精简版。
第一个决定是砍掉什么。该论文在五个层级上运行 50 个代理。我保留了包含基本逻辑的三个:宏观体制代理,其输出支配所有下游环节;资产分析师代理,使用三种相互竞争的方法估算回报;以及对抗性挑战者,其工作是找出前两个代理产生的所有错误。我削减了 20 种相互竞争的投资组合构建方法和同行评审投票层,因为那些需要我没有的基础设施。我保留的是专业化、对抗性检查和反馈循环。
第一次完整运行产生了我意想不到的东西。
代理 1 输出 — 宏观体制
- 体制:处于周期后期,滞胀风险升高
- 信心:7/10
- 主要信号:收益率曲线在短暂恢复正常后重新倒挂,高收益利差扩大,核心 PCE 连续第二个月重新加速
- 影响:减少股票久期敞口,相对于长期债券更青睐短久期信用债,保持高现金水平
代理 2 输出 — 美国股票
- 方法 1(10 年历史):预期回报 13.2%
- 方法 2(Shiller PE 估值隐含):4.8%
- 方法 3(体制调整后):5.9%
- 综合值:5.6%(估值隐含权重 50%,体制调整后权重 35%,历史权重 15%)
- 警示标志:历史与估值隐含回报之间 760 个基点的差距是自 2007 年以来最大的
代理 3 输出 — 攻击
代理 3 并没有攻击回报估算。它攻击的是体制分类本身。
它指出,收益率曲线倒挂和信贷利差扩大在实际衰退开始前都有 6 到 18 个月的领先时间。这意味着代理 2 将衰退时代的回报折现应用到了仍在运作的周期后期的环境中。相关性假设是为一种尚未到来的恶化而校准的。
然后它指出了那个能同时打破一切的场景:
软着陆,PCE 重新加速但没有衰退。美联储在第三季度之前按兵不动。股票倍数因预期最终降息而扩张。在这种情况下,估值隐含估算是错误的,因为倍数无论如何都会扩张。体制分类是错误的,因为周期延长了。投资组合最终在由代理们标记为风险的确切条件驱动的融涨中低配股票。
我从未想过那种情况。我在周末结束前更新了我的股票仓位。
## 论文实际构建了什么
研究人员于 2026 年 3 月针对一个真实的机构委托运行了他们的完整流水线:涵盖 6 种股票、8 种固定收益和 4 种另类投资类别的 18 种流动性资产类别。目标实际回报为 CPI 加 3 到 4 个百分点。波动率区间为 8 到 12 个百分点。最大回撤为负 25 个百分点。相对于 60/40 基准的跟踪误差上限为 6 个百分点。
该架构围绕投资政策声明(IPS)组织,这是管理人类投资组合经理的同一份文件。每个代理都会阅读它。每个输出都必须满足它。这不是一个细节。作为约束条件的 IPS 是防止流水线优化为委托以外目标的关键。
该流水线跨越五个不同的层级运行。

第 1 层:宏观代理
使用宏观数据、市场指标和实时网络搜索对当前经济体制进行分类。其输出流向下游的每个其他代理。在此完成之前,其他任何操作都不会运行。
第 2 层:资产类别代理(×18,并行运行)
每个资产类别一个代理。每个代理使用六种不同的方法估算预期回报,然后将它们混合成第七个综合值。一个作为法官的 LLM 步骤会结合当前的宏观体制和估值阅读所有七个输出,并选择一个具有明确权重和书面理由的最终估算值。
第 3 层:投资组合构建代理(×20)
每个代理使用不同的方法构建投资组合,从简单的规则到复杂的优化。第 21 个研究员代理扫描学术文献并提出尚未进入流水线的方法。一个独立的对抗性多元化者故意构建与所有其他代理的共识最不同的投资组合。
第 4 层:同行评审和投票
每个代理同时审查另外两个代理——一个使用相似的方法,一个使用不同的方法。所有评审同时发布。然后代理们使用博尔达计数排名进行投票。最终入围名单必须包含四大类中至少三类的代表方法。
第 5 层:元代理
在每个重新平衡周期之后,比较过去的预测与已实现的回报,识别系统性弱点,并更新管理其他代理的代码和指令。所有更改都会被记录。系统会自我重写。
## 流水线实际发现了什么
2026 年 3 月运行的结果值得理解,因为它们展示了当你从分析过程中消除人类偏见时会发生什么。
宏观代理将当前环境归类为带有滞胀风险的周期后期。
经估值调整后的预测显示出一致的跨资产类别模式:
- 美国成长型股票:预测较历史综合值低 2.0 个百分点
- 美国大盘股:较综合值低 1.1 个百分点
- 新兴市场:几乎没有调整
代理们并非普遍悲观。他们特别质疑那些当前价格已暗示未来回报较低的资产的向后看估算。一个锚定历史平均水平的人类分析师会得出非常不同的输出。
最终的投资组合配置:
- 股票:44.9%(标准 60/40 组合中为 60%)
- 债券:41.7%(大致一致)
- 现金:8.1%
1996 年至 2026 年的回测结果:
- 回报概况:与 60/40 几乎相同
- 峰值到谷底回撤:25.6% 对比 60/40 的 34.3%
相同的回报。少 8 个百分点的回撤。这就是该架构的全部论据。
研究人员诚实地承认,一次运行只是一个概念验证,而不是一个经过验证的策略。该论文并不声称建立了更好的对冲基金。它声称建立了一个可复制的过程,消除了机构投资组合管理的带宽瓶颈。
## 为什么这个架构对任何拥有 Claude 的人都是触手可及的
我从这篇论文中得到的启示不是你需要 50 个代理。而是流水线的结构、专业化角色、同行评审、对抗性检查和约束性文件,可以在任何规模上重建。
论文中的三个组件今天可以在 Claude Projects 中完全实现:
专业化 — 每个代理只有一个任务和一种输出格式。它不做一般性分析。体制代理不评论估值。资产代理不评论宏观。这种约束迫使每个输出追求深度而非广度。
对抗性多元化者 — 专门设计为不同意共识的代理是该架构中最有价值的元素。大多数构建多代理系统的人让每个代理都试图找到正确答案。这篇论文故意包含一个代理,其工作是找到最不同的答案。这种张力是风险管理产生的来源。
元代理反馈循环 — 每个周期后,绩效与预测进行比较,表现不佳的代理会收到更新后的指令。系统自我改进。这区分了多代理流水线和稍微复杂一点的提示。
## 我构建的三代理版本
我没有运行 50 个代理。我构建了三个代理,它们涵盖了流水线的基本逻辑,而不需要机构级的基础设施。

代理 1:宏观体制代理
该代理首先运行,其输出支配随后的一切。它读取当前的宏观数据、最近的美联储沟通和市场指标,然后输出带有明确推理的单一体制分类。
提示词
> 你是一名宏观体制分析师。你的唯一工作是对当前的经济环境进行分类。搜索网络以获取关于以下内容的当前数据:GDP 增长轨迹、通胀趋势、就业数据、收益率曲线形状和信贷利差。准确输出以下结构:体制:[扩张 / 周期后期 / 衰退 / 复苏] 信心:[1-10] 主要信号:[驱动此分类的单一最重要的数据点] 风险:[可能导致此分类错误的单一最大因素] 对资产配置的影响:[一句话说明该体制在历史上对投资组合定位意味着什么] 不要生成经济状况摘要。生成带有明确推理的体制分类。此输出将支配随后的两个其他代理。
代理 2:资产分析师代理
该代理针对你想分析的每个资产类别运行一次。它将代理 1 的体制分类作为必需输入,并据此调整其预期回报估算。
提示词
> 你是一名正在评估 [资产类别] 的资产类别分析师。来自宏观代理的当前宏观体制:[粘贴代理 1 输出] 使用三种不同的方法估算该资产类别在未来 12 个月内的预期回报:方法 1:过去 10 年的历史平均回报 方法 2:当前估值隐含回报(股票使用 Shiller PE,债券使用到期收益率) 方法 3:体制调整后回报(根据提供的宏观体制调整你的估算)然后生成一个明确加权每种方法的综合估算。说明你分配给每种方法的权重以及原因。标记当前估值是否建议折现历史回报。标记任何可能导致所有三个估算同时出错的因素。输出格式:三种方法估算、综合值、权重和标记。
代理 3:对抗性挑战者
这是系统中最重要的代理。它的工作不是找到正确答案。它的工作是找出代理 1 和 2 产生的所有错误。
提示词
> 你是投资组合构建流水线中的对抗性代理。你的工作不是同意在你之前的分析。你的工作是找出它可能存在的所有错误。这是宏观体制分类:[粘贴代理 1 输出] 这是资产类别回报估算:[粘贴代理 2 输出] 从四个维度攻击此分析:1. 体制分类错误:有什么证据表明体制分类是错误的或即将改变?命名具体的数据点。2. 估值盲点:哪些资产类别的下行风险被当前估算最低估了?为什么?3. 相关性假设:如果两种历史上不相关的资产一起变动,这个投资组合会怎样?哪一对风险最大?4. 没有人建模的场景:描述会使综合估算在大多数头寸上同时出错的特定宏观场景。不要客气。不要用积极因素来平衡批评。你的价值在于发现其他代理错过的东西。
## 这个设置产生了什么
按顺序运行这三个代理产生的结果,与要求 Claude 在单个提示中分析投资组合有质的不同。
专业化迫使每个代理在一个问题上更深入,而不是生成广泛的概述。体制代理不评论估值。资产代理不评论宏观。每个输出都比一般性分析提示返回的内容更狭窄、更有用。
对抗性代理是人们在构建自己的多代理系统时最容易跳过的步骤。它也是产生最有用输出的步骤。
大多数构建此类流水线的人都试图让每个代理找到正确答案。这篇论文故意包含一个代理,其全部任务是找到最不同的答案。这种张力是风险管理的来源。未经攻击的分析不是分析。那是走了额外步骤的确认偏差。
上面的例子就是它在实践中的样子。代理 3 没有发现数据错误。它发现了两个代理之间的逻辑不一致,这两个代理各自都是正确的,但集体产生了一个有缺陷的综合值。体制分类对当前时刻是准确的。估值调整对当前时刻是准确的。但在一个运作正常的周期后期环境中应用衰退时代的折现是一种类别错误,没有任何单提示分析能发现这一点,因为没有机制将分析的一个部分与另一个部分进行检查。
这就是对抗性代理的结构价值。它不需要比其他代理更聪明。它只需要寻找它们错过的东西,而不是确认它们发现的东西。
## 你可以添加的元代理层
该论文最独特的特征是比较预测与已实现回报后重写代理代码的元代理。这需要在多个周期中运行系统并记录输出。
轻量级版本:在每个周期之后,根据你记录的输出运行此提示。
提示词
> 这是此投资组合分析流水线过去 [N] 个周期的输出:[粘贴记录的输出] 这是每组预测之后随之而来的实际回报:[粘贴已实现回报] 识别:1. 哪个代理系统性地错了?在哪个方向?2. 哪些体制分类的预测准确率最差?3. 哪些资产类别的估算最 consistently 偏离?错误是方向性的吗?4. 对于记录最差的代理,指令中应该改变什么?为表现不佳的代理输出修改后的指令。具体解释原始指令中的什么内容导致了系统性错误。
这就是使系统随时间改进的反馈循环,而不是反复运行相同的分析并期望不同的结果。
## 诚实的评估
完整的 50 代理流水线需要:
- 工程基础设施
- 跨 18 个资产类别数据源的 API 连接
- 跨多个重新平衡周期的自动调度
- 元代理的数月校准期
我构建的不是那个。
我构建的是三个最重要的结构元素的 Claude 原生版本。它在一个下午就能在 Claude Project 中运行。它不会产生机构级的投资组合配置。它产生的是一个结构化的分析过程,它比单提示分析要严谨得多,因为它强迫在每一步进行明确推理,然后在你采取行动之前攻击那个推理。
论文的核心论点:代理式 AI 将投资者的角色从分析执行转变为监督。这种转变不需要 50 个代理就能成为现实。三个代理运行一个带有对抗性检查的结构化流程,就会改变你产出的分析质量,无论委托是你自己的...