# Graph Engineering 101: How to build your first Knowledge Graph from scratch (in 30 mins)
**作者**: Kanika
**日期**: 2026-07-28T06:29:16.000Z
**来源**: [https://x.com/KanikaBK/status/2081990352224027106](https://x.com/KanikaBK/status/2081990352224027106)
---
I know that this a new subject for 99% of the people.
Most people think knowledge graphs are only for big companies with data teams and complex infrastructure.
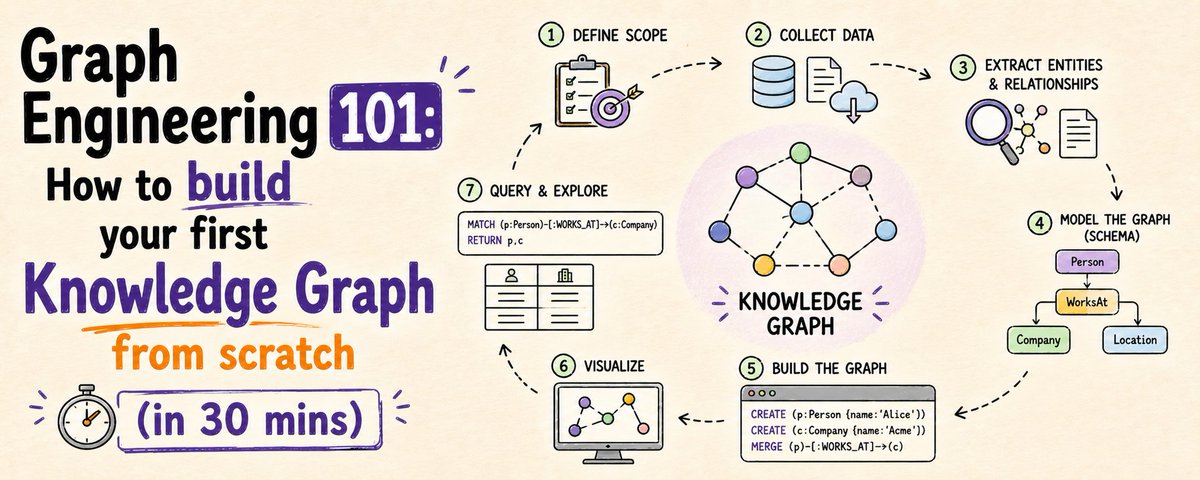
In reality, you can build a useful personal knowledge graph in 30 minutes with a simple tool, a clear structure, and a small set of connected notes.
A knowledge graph is just a network of things you care about, like projects, tools, people, ideas, and resources, connected by meaningful relationships. Instead of storing notes as isolated pages, you model how the ideas relate to each other so patterns become easier to find later.
## Why this matters
Regular notes are linear.
A knowledge graph helps you see how projects depend on tools, how ideas connect to content, and how people, concepts, and resources influence each other, which makes research, planning, and content creation much faster.
For creators and builders, that means fewer lost insights and more reuse of what you already know.
It also gives you a “second brain” that compounds over time instead of becoming a pile of disconnected files.
## What you are building
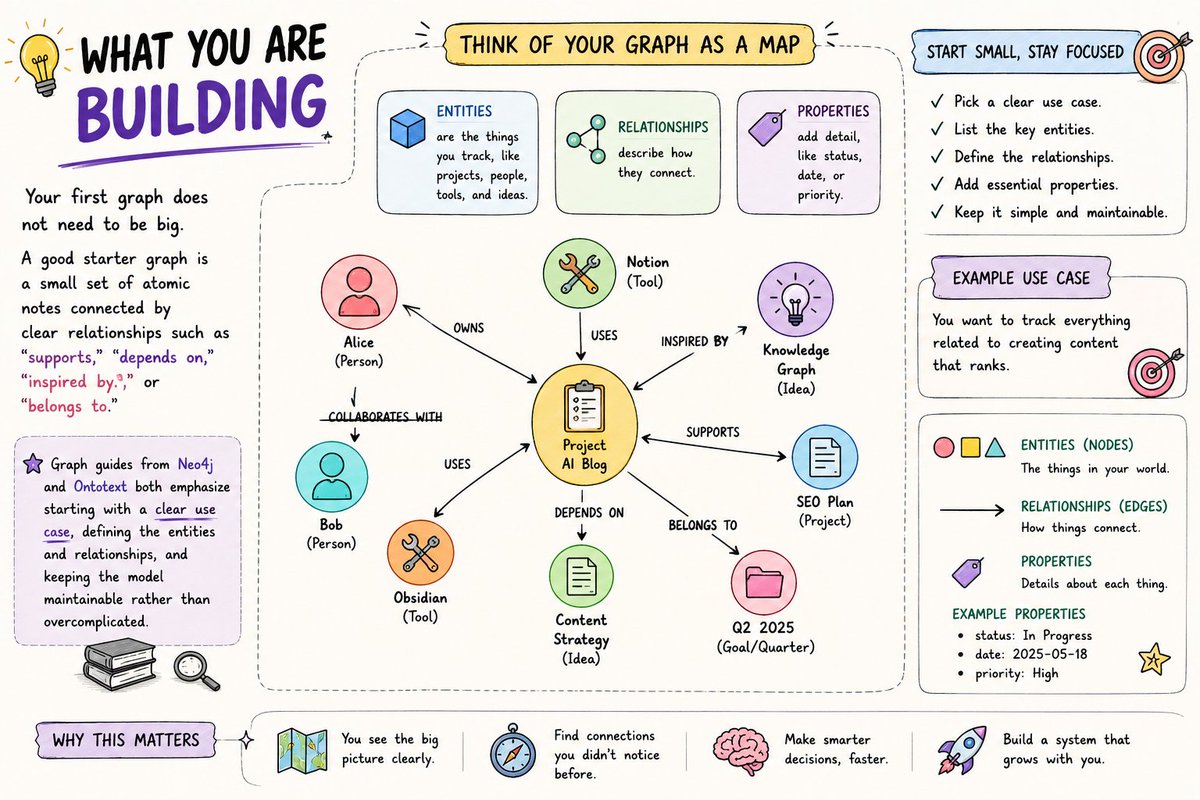
Your first graph does not need to be big.
A good starter graph is a small set of atomic notes connected by clear relationships such as “supports,” “depends on,” “inspired by,” or “belongs to.”
Graph guides from Neo4j and Ontotext both emphasize starting with a clear use case, defining the entities and relationships, and keeping the model maintainable rather than overcomplicated.
Think of your graph as a map:
- Entities are the things you track, like projects, people, tools, and ideas.
- Relationships describe how they connect.
- Properties add detail, like status, date, or priority
## 30-minute build plan
## Minutes 0–5: choose your foundation
Start with a simple note tool, and Obsidian is the most practical choice for most creators because it gives you markdown notes, backlinks, and a graph view without heavy setup.
Neo4j’s beginner guidance also stresses starting with a clear use case before you model anything.
Create a new vault or folder just for this graph. Keep the setup light so you can actually finish it today.
## Minutes 5–12: define your core entities
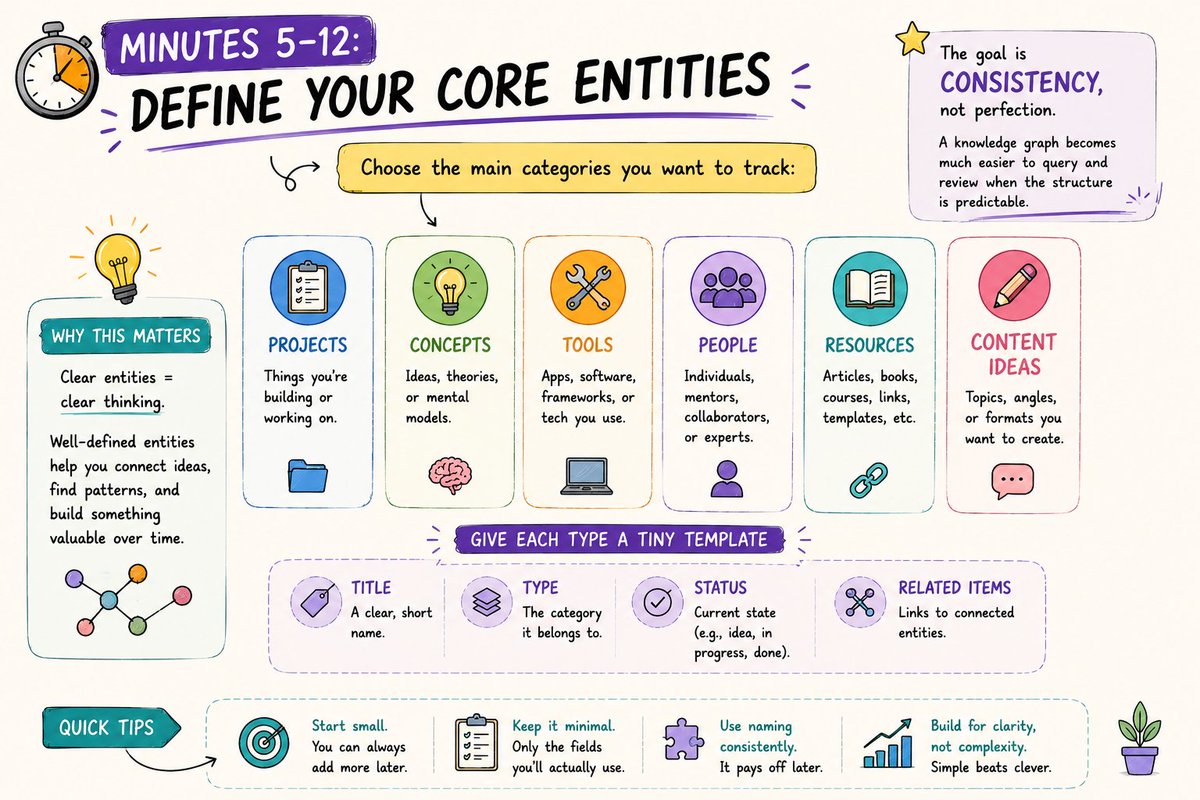
Choose the main categories you want to track:
- Projects.
- Concepts.
- Tools.
- People.
- Resources.
- Content ideas.
Give each type a tiny template with only the essentials: title, type, status, and related items.
The goal is consistency, not perfection. A knowledge graph becomes much easier to query and review when the structure is predictable.
## Minutes 12–20: create your first nodes
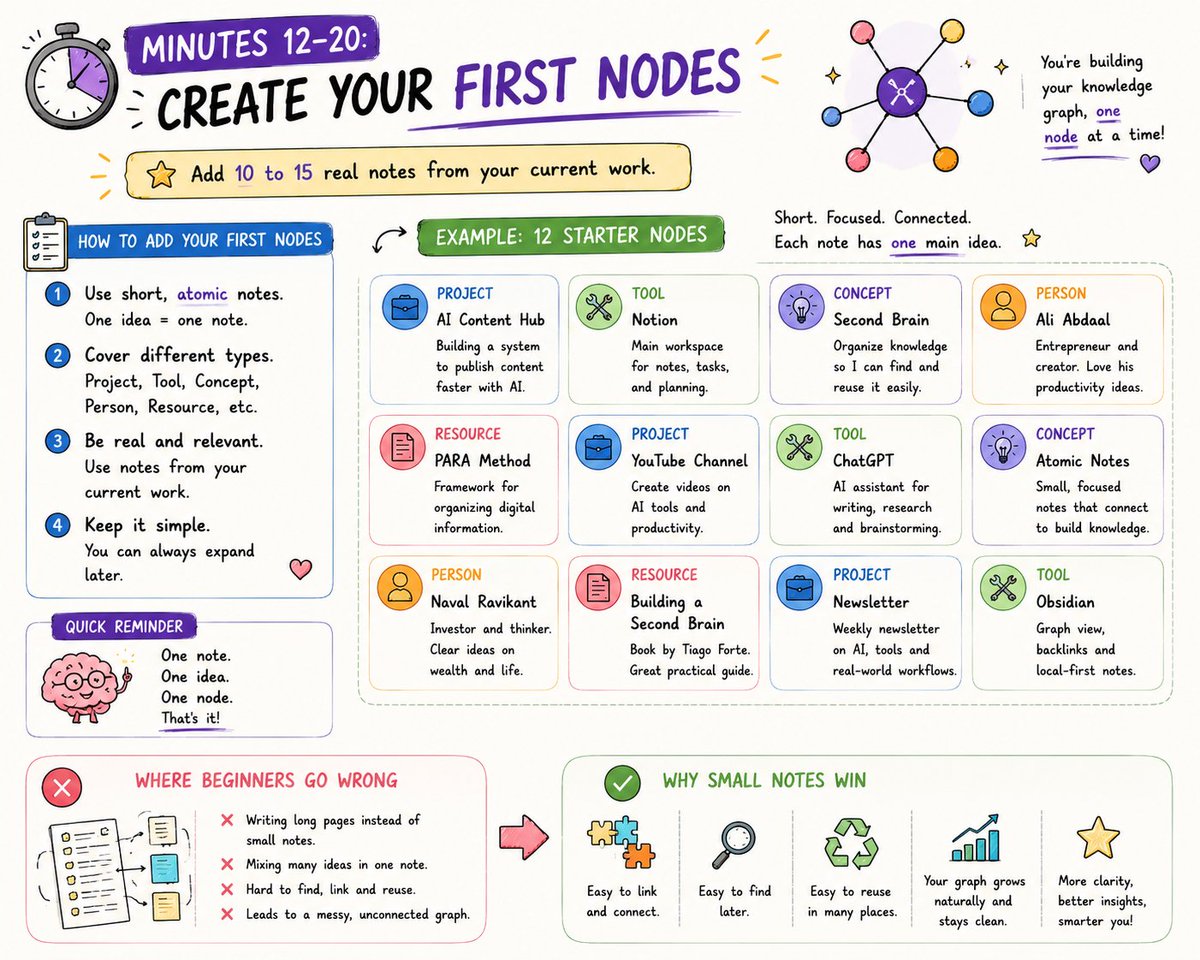
Add 10 to 15 real notes from your current work.
Use short, atomic notes with one main idea each. For example:
- one note for a project,
- one note for a tool,
- one note for a concept,
- one note for a person,
- one note for a resource.
This is where many beginners go wrong: they write long pages instead of small, connected notes. Small notes are easier to reuse and link later.
## Minutes 20–25: build the first connections
Now connect the notes intentionally.
Don’t link everything. Focus on high-value relationships such as:
- a project depends on a tool,
- an idea supports a content series,
- a resource explains a concept,
- a person is relevant to a project.
Neo4j’s model uses nodes, relationships, and properties, and that same simple logic works well for a personal graph.
## Minutes 25–30: add one query and one habit
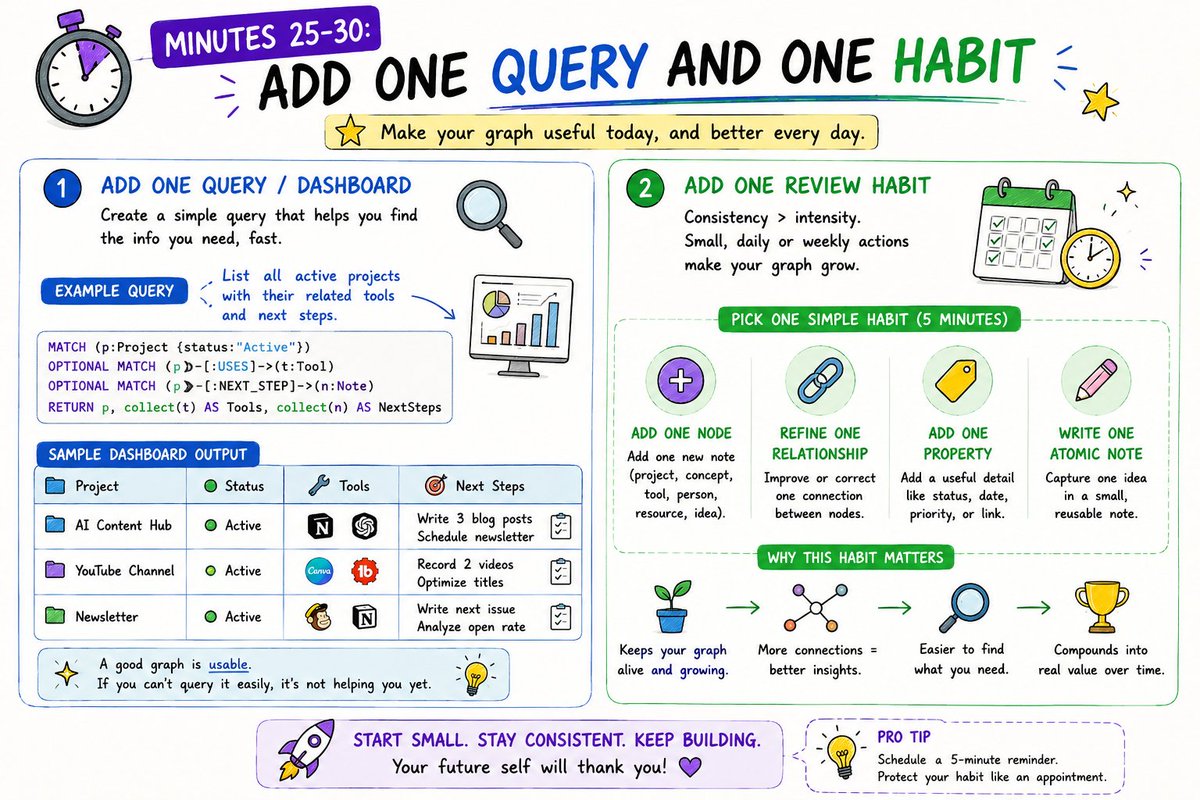
Create one simple query or dashboard that helps you retrieve useful information quickly.
For example, list all active projects with their related tools and next steps. Neo4j and Ontotext both stress that a graph should be usable, not just beautifully modeled.
Then add one review habit:
- spend 5 minutes each day or week adding one node,
- or refining one relationship.
That tiny habit is what turns a static note system into a living graph.
## Tools that make this easiest
Obsidian is the best starting point for most solo creators because it is lightweight and flexible.
If you want to go further, Dataview, Graph Analysis, and Templater are the most useful early plugins, while AI can come later to suggest links or summarize clusters.
If you prefer a database-first path, Neo4j is a strong option, and its beginner materials show how to move from use case to model to ingestion step by step.
## Common mistakes
The fastest way to fail is to try to model your entire life on day one.
Other common mistakes include writing vague or overly long notes, linking everything without clear meaning, and never returning to review or prune the graph.
A knowledge graph only becomes useful when relationships are intentional. If every note connects to everything, nothing stands out.
## What success looks like
A good first graph should let you open it and immediately see:
- what you are working on,
- what it depends on,
- which tools or ideas support it,
- and where related opportunities live.
As the graph grows, it should make research faster, surface better content ideas, and help you make decisions with less friction. That is the compounding effect you want.
## Key takeaway
Building a knowledge graph is not about complexity.
It is about intentional connection.
In 30 focused minutes, you can create a foundation that most people never build, and that foundation gets more valuable every time you add a new node or relationship.
Hope you liked the article.
Building better AI workflows for creators like you.
❣️I’m Kanika (@KanikaBK) — follow for more practical tests and setups.
## 相关链接
- [Kanika](https://x.com/KanikaBK)
- [@KanikaBK](https://x.com/KanikaBK)
- [12K](https://x.com/KanikaBK/status/2081990352224027106/analytics)
- [@KanikaBK](https://x.com/@KanikaBK)
- [Upgrade to Premium](https://x.com/i/premium_sign_up)
- [2:29 PM · Jul 28, 2026](https://x.com/KanikaBK/status/2081990352224027106)
- [12.2K Views](https://x.com/KanikaBK/status/2081990352224027106/analytics)
- [View quotes](https://x.com/KanikaBK/status/2081990352224027106/quotes)
---
*导出时间: 2026/7/29 09:02:53*
---
## 中文翻译
# 图工程入门:如何从零开始构建你的第一个知识图谱(30分钟内)
**作者**: Kanika
**日期**: 2026-07-28T06:29:16.000Z
**来源**: [https://x.com/KanikaBK/status/2081990352224027106](https://x.com/KanikaBK/status/2081990352224027106)
---

我知道这对99%的人来说都是一个新话题。
大多数人认为知识图谱只适用于拥有数据团队和复杂基础设施的大公司。
实际上,你只需要简单的工具、清晰的结构和少量相互关联的笔记,就可以在30分钟内构建一个有用的个人知识图谱。
知识图谱只是一个由你关心的事物组成的网络,比如项目、工具、人物、想法和资源,它们通过有意义的关系连接在一起。与其将笔记存储为孤立的页面,不如为这些想法之间的关系建模,这样以后更容易发现其中的规律。
## 为什么这很重要
普通的笔记是线性的。
知识图谱可以帮助你了解项目如何依赖于工具,想法如何与内容相关联,以及人物、概念和资源如何相互影响,从而使研究、规划和内容创作变得快得多。
对于创作者和建设者来说,这意味着减少灵感的流失,更多地复用你已经掌握的知识。
它还为你提供了一个能够随着时间的推移产生复利效应的“第二大脑”,而不是变成一堆互不关联的文件。
## 你要构建什么

你的第一个图谱不需要很大。
一个不错的入门图谱是由少量“原子笔记”组成的,它们通过清晰的关系(如“支持”、“依赖于”、“受启发于”或“属于”)连接在一起。
Neo4j 和 Ontotext 的图谱指南都强调,首先要有一个明确的用例,定义实体和关系,并保持模型的可维护性,而不是使其过于复杂。
你可以把你的图谱想象成一张地图:
- 实体是你追踪的对象,比如项目、人物、工具和想法。
- 关系描述了它们是如何连接的。
- 属性添加了细节,比如状态、日期或优先级。
## 30分钟构建计划
## 第0-5分钟:选择基础
从一个简单的笔记工具开始,对于大多数创作者来说,Obsidian 是最实用的选择,因为它提供了 Markdown 笔记、双向链接和图谱视图,而且不需要复杂的设置。
Neo4j 的初学者指南也强调,在建模之前首先要有一个明确的用例。
创建一个专门用于此图谱的新库或文件夹。保持设置轻量化,这样你今天就能真正完成它。
## 第5-12分钟:定义核心实体

选择你想要追踪的主要类别:
- 项目。
- 概念。
- 工具。
- 人物。
- 资源。
- 内容想法。
给每种类型创建一个微型模板,只包含最基本的内容:标题、类型、状态和相关项目。
目标是一致性,而不是完美。当结构可预测时,查询和回顾知识图谱会变得容易得多。
## 第12-20分钟:创建第一批节点

从你当前的工作中添加10到15条真实的笔记。
使用简短、原子化的笔记,每条笔记只包含一个主要想法。例如:
- 一条关于项目的笔记,
- 一条关于工具的笔记,
- 一条关于概念的笔记,
- 一条关于人物的笔记,
- 一条关于资源的笔记。
这是许多初学者容易出错的地方:他们写长篇大论而不是小而互连的笔记。小笔记更容易复用和后续链接。
## 第20-25分钟:建立第一批连接
现在有目的地连接这些笔记。
不要把所有东西都连起来。专注于高价值的关系,例如:
- 一个项目依赖于一个工具,
- 一个想法支持一系列内容,
- 一个资源解释了一个概念,
- 一个人与某个项目相关。
Neo4j 的模型使用节点、关系和属性,同样的简单逻辑也非常适用于个人图谱。
## 第25-30分钟:添加一个查询和一个习惯

创建一个简单的查询或仪表板,帮助你快速检索有用信息。
例如,列出所有正在进行的项目及其相关的工具和下一步计划。Neo4j 和 Ontotext 都强调,图谱应该是可用的,而不仅仅是建模得很漂亮。
然后添加一个回顾习惯:
- 每天花5分钟或每周花一段时间添加一个节点,
- 或者优化一个关系。
正是这个微小的习惯将静态的笔记系统变成了一个鲜活的图谱。
## 让这变得最简单的工具
Obsidian 是大多数独立创作者的最佳起点,因为它轻量且灵活。
如果你想进一步深入,Dataview、Graph Analysis 和 Templater 是最有用的早期插件,而 AI 可以稍后再介入,用于建议链接或总结集群。
如果你更喜欢以数据库为先的路径,Neo4j 是一个强有力的选择,它的入门材料展示了如何一步步从用例到模型再到数据导入。
## 常见错误
失败最快的方法是试图在第一天就为你整个生活建模。
其他常见的错误包括写模糊或过长的笔记,在没有明确意义的情况下连接所有东西,以及从不回顾或清理图谱。
只有当关系是有意识的时候,知识图谱才会变得有用。如果每条笔记都连接到所有东西,就没有任何东西能突显出来。
## 成功的样子
一个好的第一个图谱应该让你打开它就能立即看到:
- 你在做什么,
- 它依赖于什么,
- 哪些工具或想法在支持它,
- 以及相关的机会在哪里。
随着图谱的增长,它应该能加快研究速度,激发更好的内容创意,并帮助你在阻力更小的情况下做出决策。这就是你想要的复利效应。
## 核心要点
构建知识图谱不是为了复杂。
而是为了有意识的连接。
在30分钟的专注时间里,你可以创建一个大多数人都从未构建过的基础,而且每当你添加一个新的节点或关系时,这个基础就会变得更有价值。
希望你喜欢这篇文章。
为像你这样的创作者构建更好的 AI 工作流。
❣️我是 Kanika (@KanikaBK) — 关注我获取更多实用的测试和设置。
## 相关链接
- [Kanika](https://x.com/KanikaBK)
- [@KanikaBK](https://x.com/KanikaBK)
- [12K](https://x.com/KanikaBK/status/2081990352224027106/analytics)
- [@KanikaBK](https://x.com/@KanikaBK)
- [Upgrade to Premium](https://x.com/i/premium_sign_up)
- [2:29 PM · Jul 28, 2026](https://x.com/KanikaBK/status/2081990352224027106)
- [12.2K Views](https://x.com/KanikaBK/status/2081990352224027106/analytics)
- [View quotes](https://x.com/KanikaBK/status/2081990352224027106/quotes)
---
*导出时间: 2026/7/29 09:02:53*