# We found 21 money-printers after backtesting 236 TradingView strategies
**作者**: Minara AI
**日期**: 2026-04-15T15:05:50.000Z
**来源**: [https://x.com/minara/status/2044432012002635843](https://x.com/minara/status/2044432012002635843)
---

> TL; DR
> - We tested 236 public TradingView strategies trade-by-trade under HyperLiquid's real fees
> - 63 passed strict replication. 36 were profitable. 21 cleared 10% annualized return
> - Trade frequency is the main fee killer: every strategy that flipped from profitable to losing traded 200+ times per year
> - Low-frequency strategies kept almost all of their edge. The best: 16 trades in 90 days, +204% annualized
> - The industry-standard ±15% PnL bar would have passed ~103 strategies. Trade-by-trade matching passed 63. The gap is strategies that look replicated but aren't
> - We also tried to fix 4 broken strategies. In-sample: all improved. Out-of-sample: one test showed the gains didn't hold
Over the past three months, our team built a pipeline that collects public PineScript strategies, rebuilds each one in our internal-testing Strategy Studio, replicates every trade against TradingView's own backtest engine, and re-runs everything under HyperLiquid's real fee structure (0.015% maker, 0.045% taker). We ran 236 strategies through this pipeline on major pairs (BTC, ETH, SOL, XRP, BNB, DOGE) and supported timeframes, only 21 cleared 10% APR.
This article covers the pipeline, the aggregate results, and four specific strategies that tell different stories about what happens between a TradingView screenshot and a live order book.
## The pipeline
The full process runs in four stages:
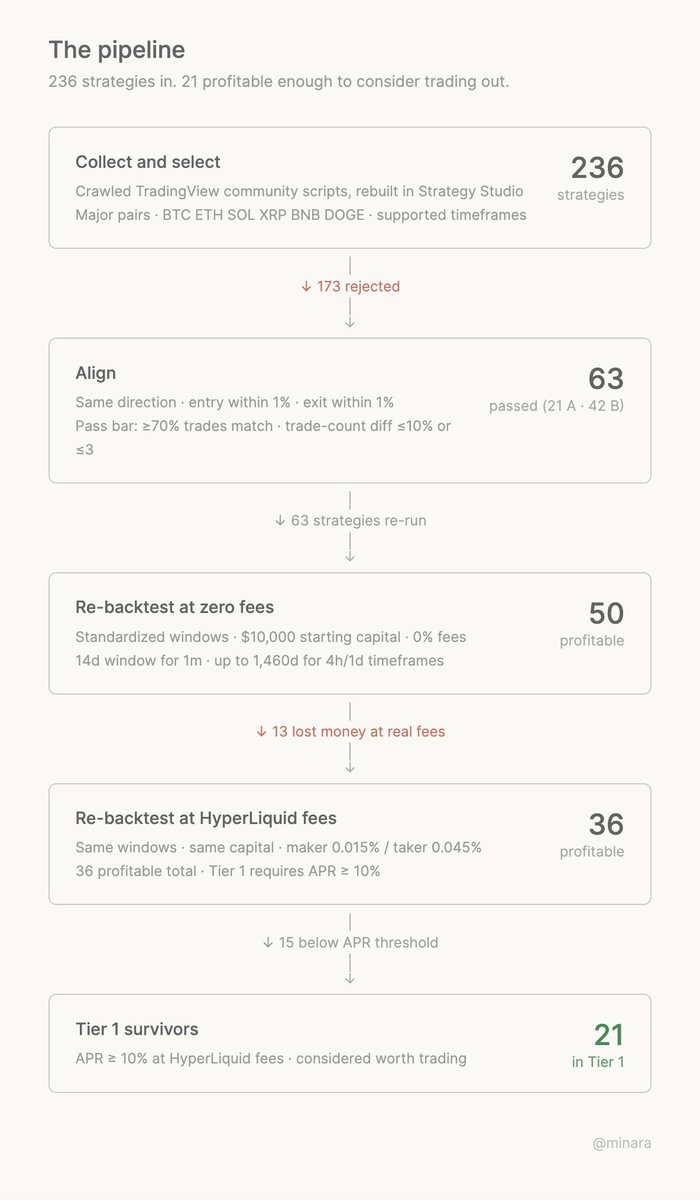
Collect and select. We crawled publicly available PineScript v5 strategies from TradingView's community library, filtered for strategies trading major pairs (BTC, ETH, SOL, XRP, BNB, DOGE) on supported timeframes, and rebuilt 236 of them in Strategy Studio.
Align. Each strategy ran on Strategy Studio under identical conditions: same capital, commission, position sizing, and date range as the original TradingView backtest. We matched every trade on three conditions: same direction, entry price within 1%, and exit price within 1%. A strategy passed alignment if at least 70% of its TradingView trades had a matching Strategy Studio trade, and the total trade count differed by no more than 10% (or 3 trades). 63 of 236 passed: 21 at the stricter "A" bar (≥90% match, ≤10% PnL divergence), 42 at "B". The remaining 173 showed trade-level discrepancies that no sensible parameter tuning would close.
Re-backtest at zero fees. All 63 aligned strategies ran again on standardized windows (14 days for 1m, 60 days for 5m, 90 days for 15m, 365 days for 30m, 730 days for 1h, 1,460 days for 4h and 1d) with $10,000 starting capital and zero fees. This isolates the strategy logic from execution costs.
Re-backtest at HyperLiquid fees. Same windows, same capital, but with maker 0.015% and taker 0.045%. The backtest engine simulates fees only; a live HyperLiquid market order reserves additional slippage tolerance, but we do not model that here because it would reduce comparability with TradingView's own report. This is the number that matters if you plan to trade it.
The alignment step alone took weeks of debugging. Differences in how TradingView and Strategy Studio handle bar magnets, DST transitions, and contract-based position sizing required manual corrections for several strategies. The total engineering effort exceeded 300 hours.
## Numbers
Of the 63 aligned strategies with recent dual-fee backtest data:
- 21 produced annualized returns above 10% (Tier 1)
- 15 were profitable but below 10% APR (Tier 2)
- 27 lost money (Tier 3)
- 57% of strategies remained profitable after real fees
- Median APR after fees: +2.4%
- Median Sharpe after fees: +0.41
(click the image for full-size leaderboard)

The 21 money-maker straties are:
- Optimized BTC Mean Reversion (RSI 20/65) — BTCUSDT 15m, +204.6% APR
- Volatility Breakout System [Fixed Risk] — ETHUSDT 1h, +124.6% APR
- SuperTrend AI Adaptive - Strategy [BTC] — BTCUSDT 4h, +60.2% APR
- BB Upper breakout Short +2% (dr Ziuber) — SOLUSDT 1h, +48.1% APR
- SuperTrend STRATEGY — BTCUSDT 1d, +35.6% APR
- Penguin Volatility State Strategy — BTCUSDT 1d, +34.5% APR
- MACD Zero-Line Strategy (Long Only) — BTCUSDT 1d, +34.5% APR
- CDC BACKTEST (MACD) FIX AMOUNT $200k per trade — BTCUSDT 1d, +34.5% APR
- Hash Momentum Strategy — BTCUSDT 4h, +32.8% APR
- Moon Phases Long/Short Strategy — BTCUSDT 1h, +29.9% APR
- 7/19 EMA Crypto strategy — ETHUSDT 30m, +28.4% APR
- RSI > 70 Buy / Exit on Cross Below 70 — BTCUSDT 4h, +24.3% APR
- 50 & 200 SMA + RSI Average Strategy (Long Only, Single Trade) — ETHUSDT 1d, +23.5% APR
- Kadunagra-Pivot Point SuperTrend-trades analysis — BTCUSDT 4h, +23.2% APR
- ETHUSDT 4H - Keltner Breakout — ETHUSDT 4h, +21.0% APR
- Hash Supertrend [Hash Capital Research] — SOLUSDT 4h, +15.2% APR
- Crypto LONG PY — SOLUSDT 5m, +12.2% APR
- Oleg_Aryukov_Strategy — BTCUSDT 15m, +10.9% APR
- Options test Daily Long 08:30 Exit next day 08:00 UTC — ETHUSDT 5m, +10.8% APR
- Qullamagi EMA Breakout Autotrade (Crypto Futures L+S) — ETHUSDT 1h, +10.5% APR
- Kinetic Kalman Breakout — ETHUSDT 15m, +10.1% APR
The top of the Tier 1 table under HyperLiquid fees is not what a trend follower would expect. The best performer is an optimized BTC mean-reversion strategy on 15m that placed 16 trades in 90 days and returned +204% annualized, with a Sharpe ratio above 4. Second is an ETH 1h momentum strategy at +124% APR. Third is an adaptive SuperTrend on BTC 4h at +60% APR. The top of the leaderboard mixes mean reversion, momentum, and trend following. No single approach dominated.
The middle of the table is where fee sensitivity starts to bite. The 15 Tier 2 strategies all made money, but barely. Many of them would have ranked Tier 1 at zero fees and dropped below the 10% threshold only when fees were applied. Their logic works; their trade frequency erodes the edge.
At the bottom of the distribution, losses accelerate. The pattern is the same each time: high trade count, low win rate, thin per-trade margin. Buy Sell Signal on BTC 1m is the canonical example we have seen across iterations of this pipeline: 2,655 trades in 14 days, a -64.7% loss on capital, which extrapolates to -1,687.6% APR. It paid more in fees than it could have possibly earned.
The strategies with very high win rates in this dataset are all built the same way: take a small fixed profit, exit quickly, re-enter. BB Upper Breakout Short +2% on SOL 1h hit 100% over 49 trades. Crypto LONG PY on SOL 5m hit 100% over 39 trades. OrangePulse v3.0 Lite on BTC 1h hit 94.9% over 118 trades. These are mean-reversion strategies with small, fixed profit targets, and their structure is also their weakness. Each winner is small, and the round-trip fee eats a constant 0.06%. When the average winner makes 1.5%, fees consume roughly 4% of the edge before anything else. OrangePulse survived this with a +0.1% APR. The next strategy down the list did not.
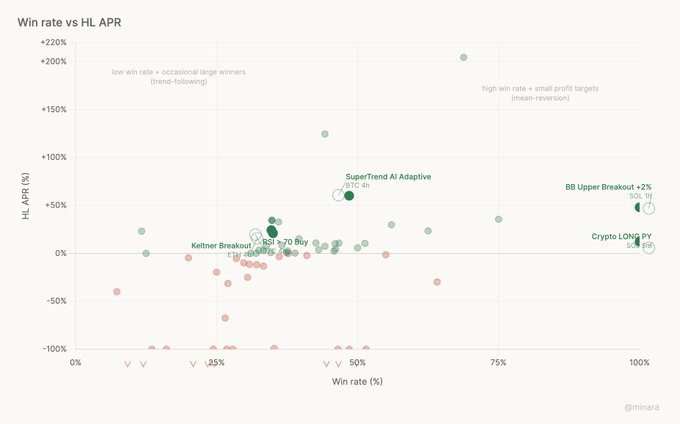
The inverse profile looks worse on paper and performs better in practice. RSI > 70 Buy on BTC 4h has a win rate around 35%. It loses nearly two trades out of three. SuperTrend AI Adaptive sits near 48%. Keltner Breakout near 34%. These are trend-following strategies where most trades lose a little and a few trades win a lot. The occasional large winners absorb fee costs without effort. Most of the Tier 1 strategies by annualized return after fees have win rates between 35% and 50%. A low win rate paired with a high profit factor is the profile that survived.
SuperTrend STRATEGY, a Tier 1 performer on BTC 1d, carried a 46.1% max drawdown across its 4-trade history. RSI > 70 Buy also cleared Tier 1 with a 14.8% max drawdown and a Sharpe ratio above 2. Holding through a 46% drawdown is a different experience than holding through a 15% one, even if the final number at the end of the period is larger.
Sharpe ratios sort the dataset differently than raw APR. The highest Sharpe in Tier 1 belongs to a 15-minute mean-reversion strategy that took very few trades over a short window. RSI > 70 Buy and SuperTrend AI Adaptive are also near the top on risk-adjusted measures. A low APR with a contained drawdown and a high Sharpe can represent a more tradeable position than a high APR that requires surviving near-ruin first.
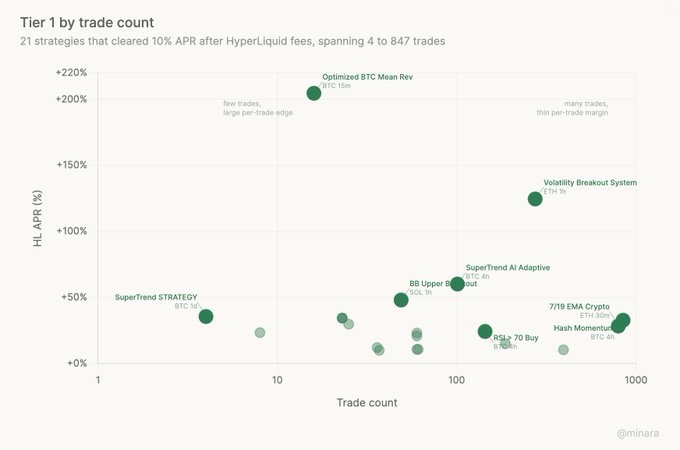
Profit factors tell a related story. SuperTrend's 8.98 means its total profits were nearly nine times its total losses. That ratio explains why four trades were enough to rank in Tier 1. Other Tier 1 strategies get their edge from many smaller wins, per-trade margins distributed across dozens or hundreds of positions. Both work. They work differently.
The top of the Tier 1 list mixes mean reversion, momentum, and trend following. Complex multi-factor systems and simple single-parameter strategies both appear. Neither complexity nor simplicity predicted returns consistently across the 63 strategies. What predicted returns was the match between the strategy's per-trade profile and the fee environment it would trade in. No indicator or filter combination dominated Tier 1: trend following appeared most often, but Bollinger Bands, Keltner channels, EMA crossovers, MACD, and calendar-based entries all produced Tier 1 members.
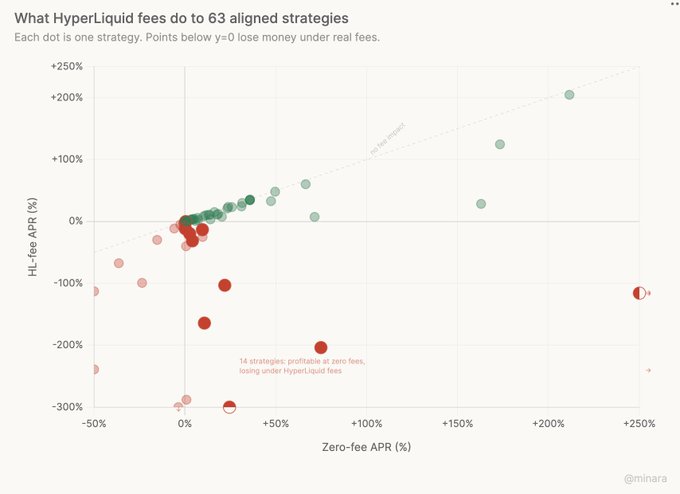
The primary driver of fee impact was not strategy type, asset, or timeframe. It was trade count. Of the 63 strategies in the analysis pool, 14 were profitable at zero fees and lost money once HyperLiquid fees were applied. Every one of those 14 traded above 200 times per year. Strategies that traded fewer than 25 times per year retained almost all of their zero-fee return.
The strategies skewed toward trend following, with the most common timeframes being 4h and daily. BTC was the most-traded asset, but the pool also includes ETH, SOL, XRP, BNB, and DOGE strategies.
The aggregates above flatten 63 strategies into averages and tiers. The four cases below break the averages apart: a mean-reversion short with a 100% win rate, a trend follower that fires four times in four years, a momentum play that buys overbought conditions, and a classic moving-average strategy that beat a losing market. Each one looks wrong on paper. Each one worked.
(All cases below were run in the internal test build of Strategy Studio. To apply for early access, see the link at the end of this article.)
## Case 1: The 100% win rate short, BB Upper Breakout Short +2% by @DrZiuber, SOLUSDT, 1h
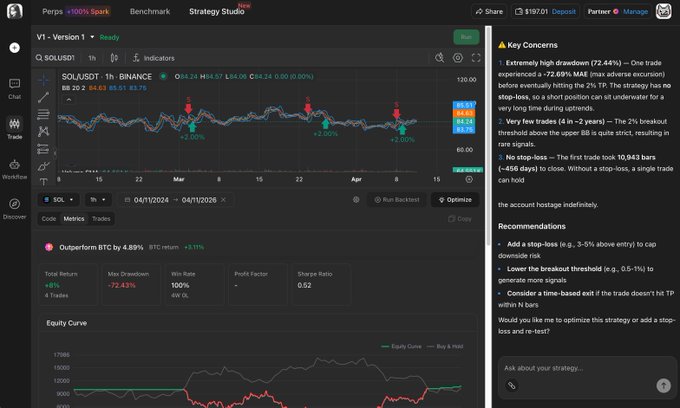
This strategy shorts SOL when the price breaks 2% above the upper Bollinger Band (20-period, 2 standard deviations) and exits at 2% profit. It is a textbook mean reversion play: when an asset spikes too far above its recent range, sell it and wait for the pullback.
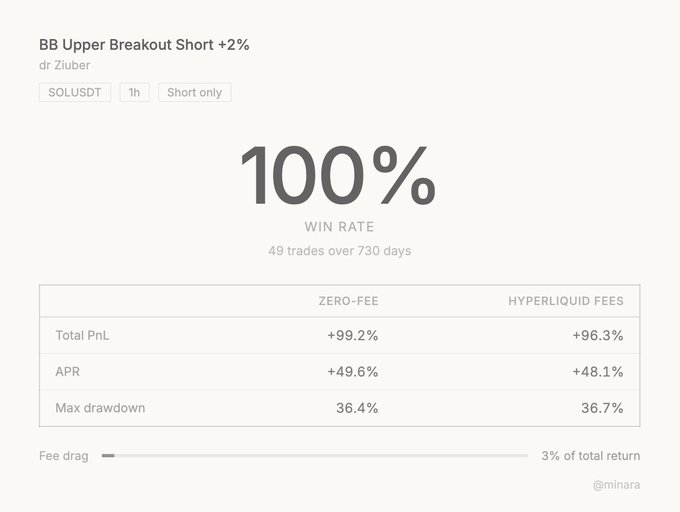
Over 730 days, it placed 49 trades. Every single one was profitable. Win rate: 100%.
Under HyperLiquid fees, it returned +96.3% total, or +48.1% annualized. The fee drag was 3%, almost nothing, because the strategy trades infrequently and takes a meaningful profit on each position.
The alignment check was clean: Strategy Studio matched TradingView's results within 2%, with identical trade counts.
There are obvious caveats. Forty-nine trades over two years is a small sample. The strategy only works on SOL, which has had a specific volatility profile during this period. A 100% win rate over 49 trades does not imply a 100% win rate over the next 49. And the max drawdown was 36.7%, meaning at one point the strategy was sitting on a significant unrealized loss before the reversion completed. The caveats are real. So is the edge.
## Case 2: Four trades in four years, SuperTrend STRATEGY by holdon_to_profits, BTCUSDT, 1d
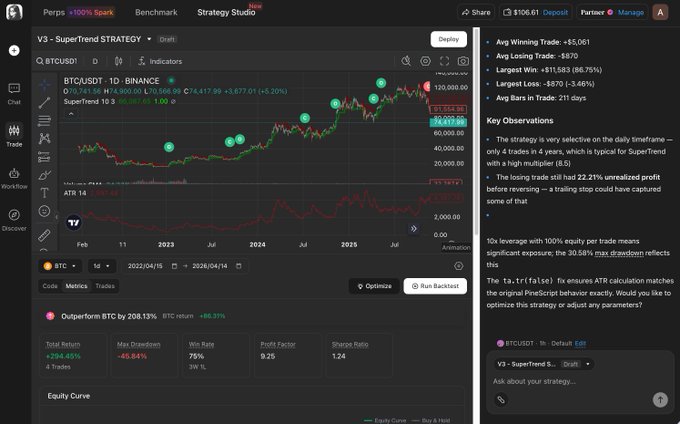
Most strategies try to catch as many moves as possible. This one does the opposite. It runs a classic SuperTrend indicator (ATR period 10, multiplier 8.5) on BTC daily candles and goes long when the trend flips bullish. The high multiplier means it ignores almost everything. Only major trend reversals trigger a signal.
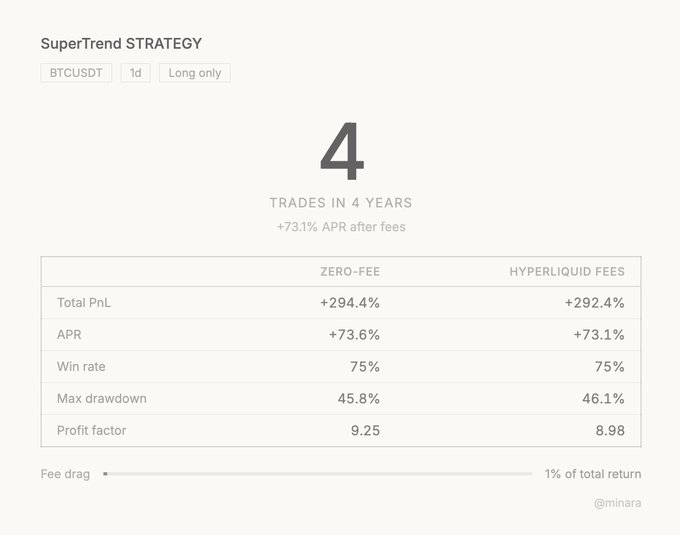
Over four years (1,460 days), it placed four trades. Three were winners, one was a loser. Total return under HyperLiquid fees: +292.4%, or +73.1% annualized.
The fee drag was 1%. Four trades in four years means the strategy paid fees eight times total (entry and exit). Under HyperLiquid's fee structure, that cost was functionally irrelevant.
The Sharpe ratio was 1.24. The profit factor was 8.98. The max drawdown was 46.1%, which is large but expected. When you hold BTC through a trend reversal with no stop loss, you ride the drawdown until the SuperTrend flips.
Four trades is a small sample even when they cover four years of daily candles. The profit factor of 8.98 is accurate for the period tested; the confidence interval around that number is wide. The rank is real. It is also partly an artifact of a narrow trade count on a favorable window.
The alignment with TradingView was tight: 7% PnL divergence, identical trade count (7 trades during the TV backtest window), identical win rate.
The SuperTrend with a high multiplier is barely a strategy at all. It is closer to "buy BTC when it starts a bull market, sell when it ends." Of the 37 strategies we tested, 34 used more signals, more filters, and more logic. This one used ATR and a multiplier. It ranked second.
## Case 3: Buying overbought, RSI > 70 Buy / Exit on Cross Below 70 by Boubizee, BTCUSDT, 4h
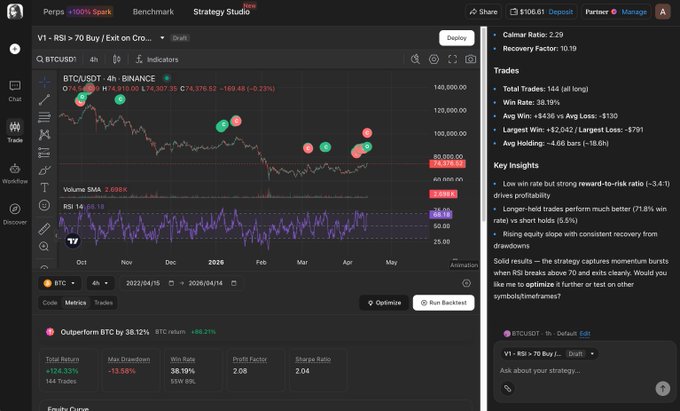
Every beginner learns the same rule: RSI above 70 means overbought, time to sell. This strategy does the opposite. It buys BTC when RSI(14) crosses above 70 and exits when RSI drops back below 70. It is a momentum continuation play: the assumption is that a strong RSI reading signals strength, not exhaustion.
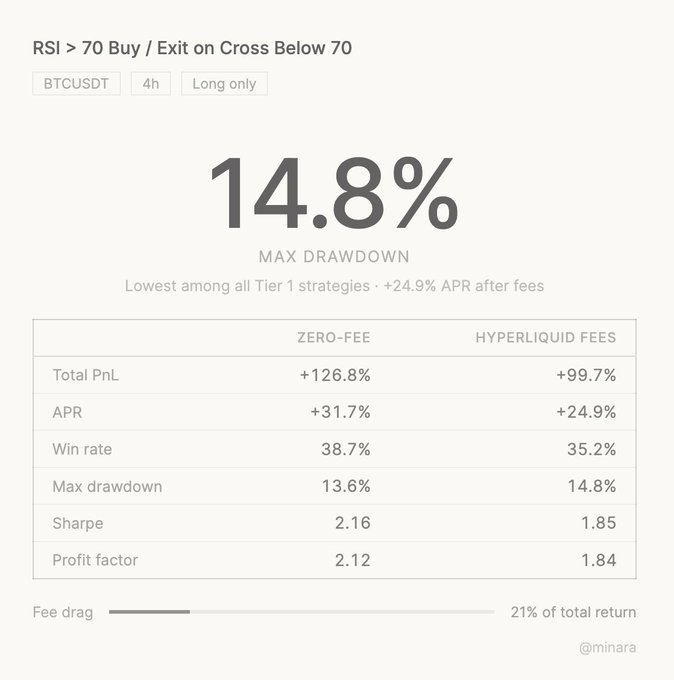
Over 1,460 days, it placed 142 trades. Win rate: 35.2%. Under HyperLiquid fees, it returned +99.7% total, or +24.9% annualized.
The Sharpe ratio was 1.85. The max drawdown was 14.8%. +24.9% annually with a 14.8% max drawdown is a better risk-adjusted profile than most strategies in our dataset that returned higher nominal APR.
Fee drag was 21%, meaningful but not disqualifying. At 142 trades over four years, the round-trip cost on each trade averaged roughly 0.06%. The per-trade edge was large enough to survive it.
Alignment was clean: 2% PnL divergence against TradingView, with matching trade counts.
Indicator thresholds are heuristics, not laws. On BTC at 4h, over four years and 142 trades, RSI above 70 more often meant momentum than exhaustion.
## Case 4: Beating a losing market, 50 & 200 SMA + RSI Average Strategy by muratkbesiroglu, ETHUSDT, 1d

This strategy uses one of the oldest ideas in trend following: go long when price sits above both the 50-day and 200-day SMA, and when a smoothed RSI (9-period average of RSI-21) is above 57. Exit when price drops below the 50-day SMA and the RSI average falls back under 57. Long-only, one position at a time, no leverage.
Over the test window, it placed 19 trades. Under HyperLiquid fees, it returned +95.1% while ETH buy-and-hold returned -22.1%. The strategy beat the market by +117 percentage points in a period when simply holding ETH lost money.
The Sharpe ratio was 1.16. The strategy stayed out of the market during most sideways and down periods, which is why it outperformed buy-and-hold by such a wide margin: the 57-threshold RSI filter forced it to sit in cash during low-momentum conditions that dragged long-term holders.
The alignment check was near-perfect: 19 of 19 trades matched TradingView's engine, with PnL within 0.1 percentage points (1,072.0% vs 1,071.9% over the TV test window).
Most strategies in this article beat buy-and-hold during a period when buy-and-hold was doing well. This one beat buy-and-hold during a period when buy-and-hold was losing. That is a different kind of test, and a harder one. The textbook answer still works; the discipline to stay out of the market during weak periods is what makes it work.

## Optimization
The four cases point at the same pattern from different angles. What made them work was not indicator choice, win rate, or complexity. It was the match between per-trade edge and fee cost: each strategy either traded infrequently enough to preserve its edge, or took profits large enough to absorb the round-trip. The SuperTrend on BTC 1d paid fees eight times in four years. The mean-reversion short on SOL traded 49 times across 730 days. The RSI continuation play won only one trade in three, but the winners were large enough that fees barely registered. The SMA strategy's edge was not in what it traded but in what it skipped: the RSI filter kept it in cash during the periods that dragged long-term holders underwater.
Replication is one thing Minara does. The four cases below show another: take a strategy from the losing end of the dataset, identify what is structurally wrong, and fix it. The fixes range from a four-line patch to a complete rewrite, and not all of them held up on out-of-sample data. These are the typical optimization cases we encountered during testing.
## Rescue 1: Buy Sell Signal Strategy → Quant Trend Engine-style logic (complete rewrite)
The first target was the Buy Sell Signal Strategy, a 1-minute BTC scalper that placed 2,655 trades in 14 days and lost 64.7% of its capital under HyperLiquid fees. Minara refused to tune the strategy and rewrote it from scratch, borrowing structural elements from high-ranking templates in our dataset. The result is a 4h multi-factor trend follower, structurally unrelated to the original EMA cross logic.
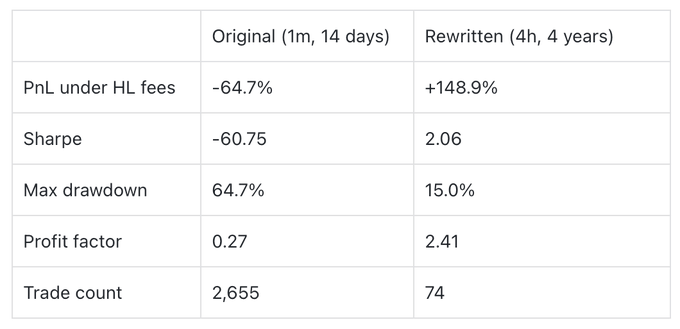
What Minara changed:
- Timeframe: 1m → 4h. The 1m window produced 2,655 trades in 14 days. The 4h window produces about 18 trades per year. The per-trade edge needed to survive fees dropped from an impossible 0.09%+ to a reachable 0.2 to 0.5%.
- Entry: single EMA cross → 8-factor weighted score. The rewrite requires a minimum score of 5.0 across EMA stacking, slope, separation, momentum persistence, path efficiency, breakout strength, ATR regime, and pullback reclaim. No single factor can fire an entry alone.
- Added a Path Efficiency filter. Kaufman Efficiency Ratio ≥ 0.33. This single filter blocks entries during sideways markets, where the original strategy accumulated most of its losses.
- Stop loss: 0.5 ATR fixed → 2% hard stop + 2.8 ATR trailing. Tight ATR stops on 1m get eaten by noise. The trail gives real trends room to run.
- Direction: long & short → long only. BTC's long-term beta is positive. Shorting a structurally upward-drifting asset gives up edge before any strategy logic applies.
- 5-bar cooldown after exits. Prevents re-entry into the same noise pattern that just triggered the previous stop.
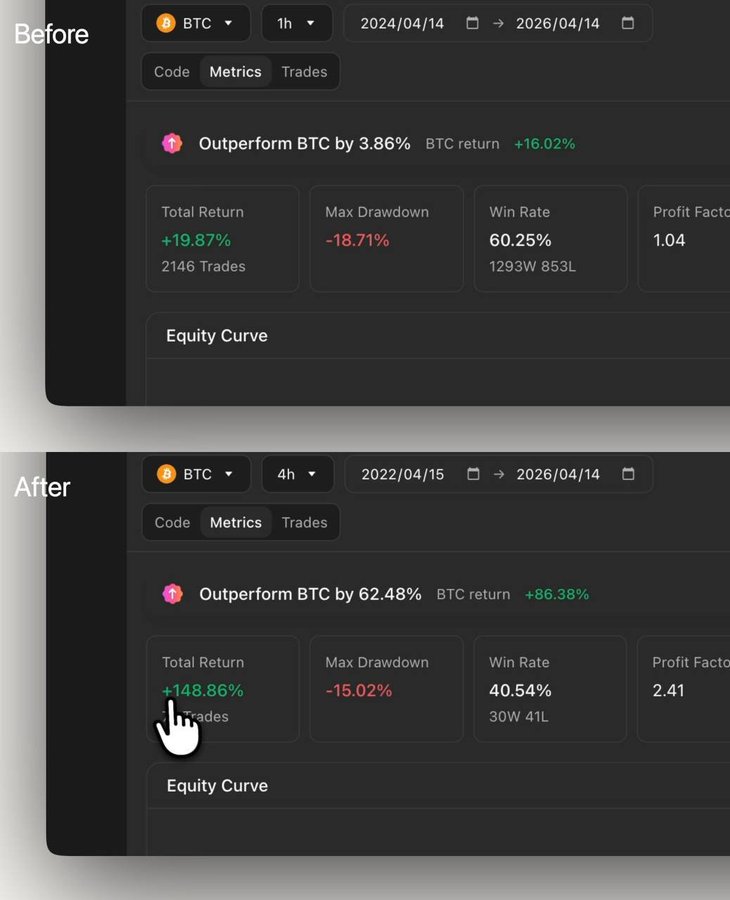
Minara did not invent this structure. It selected a skeleton similar to Quant Trend Engine, already the top performer in our dataset, and adapted it for the original strategy's asset. Diagnosing when a strategy is structurally unsalvageable and proposing a known-good replacement is more useful than pretending parameter tuning will work.
## Rescue 2: XRP Non-Stop Strategy by antishyilma81 → XRP Trailing ATR
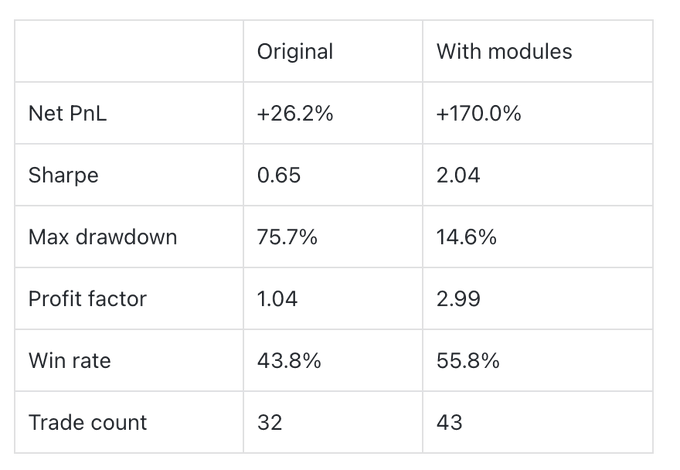
The second target was the XRP Non-Stop Strategy, a long-only trend-follower using EMA 20/50 filtering with a fixed 25% take profit and 15% stop loss. Over 730 days it returned +26.2% PnL with a 43.8% win rate. The problem was not the nominal return. The problem was a 75.7% max drawdown and a profit factor of 1.04, meaning the strategy survived only because one eventual win happened to offset accumulated losses. Minara kept the skeleton (EMA filter, long-only, 25% take profit, XRP ticker guard) and added four modules around it.
What Minara changed:
- Stop loss: fixed 15% → 2.5 ATR initial, 2.0 ATR trailing, ratchet-only. The fixed 15% was either too tight in high-volatility regimes or too loose in low-volatility ones, and it offered no protection on unrealized gains. The ATR trail locks profit as price advances. This single change accounts for most of the drawdown reduction from 75.7% to 14.6%.
- RSI entry filter: require RSI < 45. Counter-intuitively strict. With EMA already confirming the uptrend, entries fire only when RSI dips, buying pullbacks instead of breakouts. Win rate rose from 43.8% to 55.8%.
- ATR regime filter: skip when ATR/price < 1.5%. Low-volatility windows produce false EMA crosses and tight stops that get scraped. Blocking those windows raised profit factor from 1.04 to 2.99.
- 3-bar cooldown after exits. Prevents re-entering the same chop pattern that just triggered the stop.
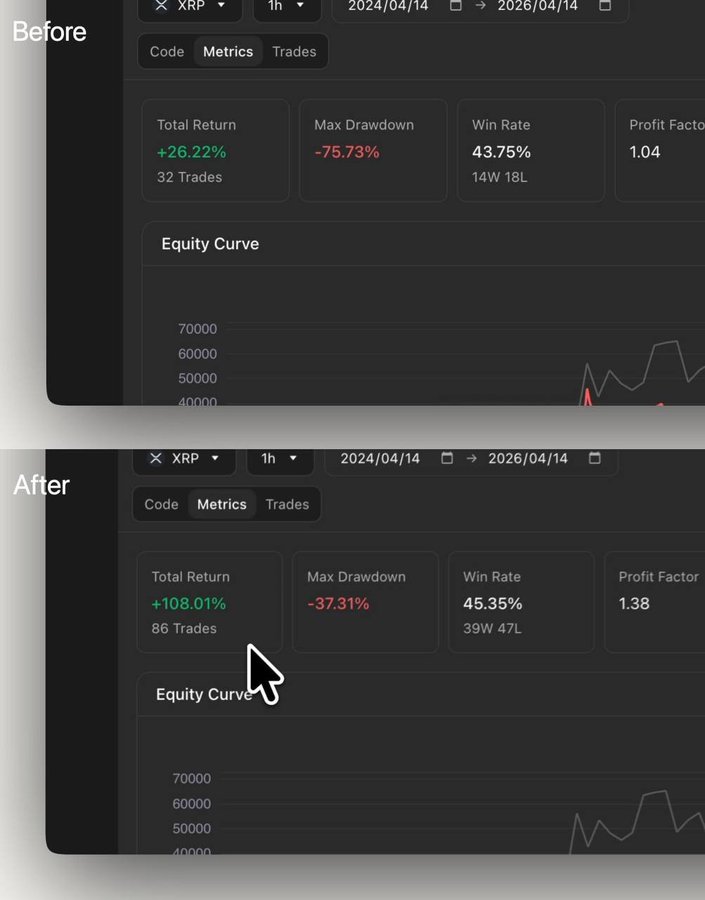
The strategy is trading more but with higher per-trade quality. Minara also reported four alternatives it tested and rejected: a tighter 1.5 ATR trail got scraped by normal pullbacks, shorter EMAs produced more false crosses, a closer 15% take profit capped winners and collapsed the profit factor, and an 8-bar cooldown missed continuation entries. The rejected branches define the parameter space as much as the accepted changes do.
## Rescue 3: EMA 50/200 Pullback + RSI (BTC/USDT 15m - 2 Bar Logic)
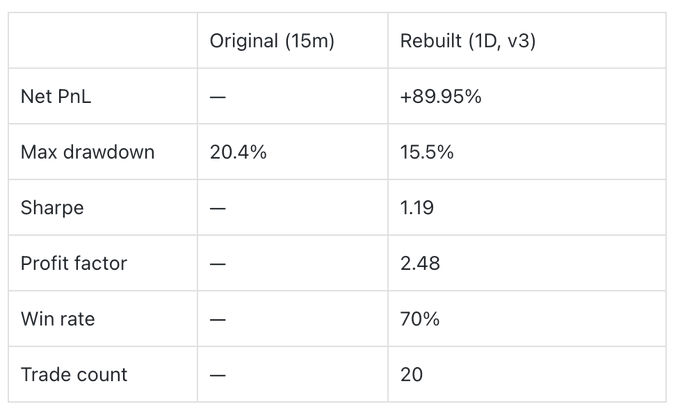
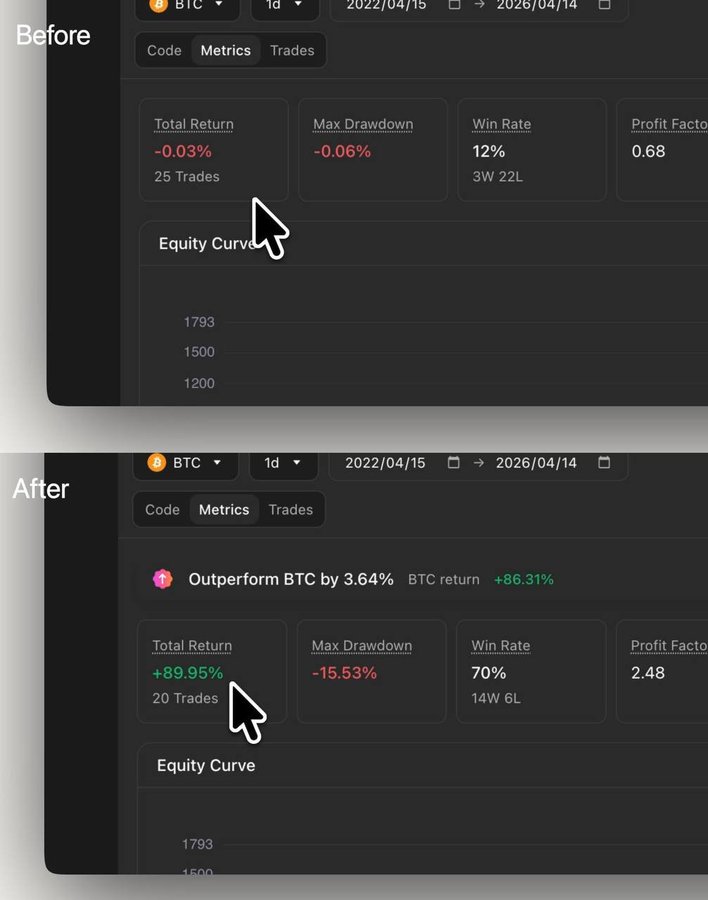
The third target was the EMA 50/200 Pullback strategy on BTC 15m, which used a 2-bar pullback-and-reclaim signal with a fixed 0.49% stop and a 1:5 reward ratio. The skeleton was reasonable. The execution scale was wrong: a 0.49% stop on 15m is sitting inside normal noise, and the 1:5 reward ratio looks attractive on paper but is unreachable in practice when most trades stop out before reaching target. Minara changed the timeframe, replaced the risk model, added a trend filter, added a trailing stop, and tightened the entry conditions.
In-sample results (2022-04 to 2025-01, 2.8 years):
What Minara changed:
- Timeframe: 15m → 1D. A 0.49% stop on 15m is roughly 0.16 ATR (inside normal noise). On daily, the same percentage is ~0.5 ATR (a meaningful move). The pullback-and-reclaim signal also shifts from a microstructure event to a structural one across two days.
- Risk model: fixed 0.49% / 2.45% at 1x → ATR-scaled 1.5 / 4.0 at 20x leverage. Risk-reward drops from a paper 1:5 to a real 1:2.63. The original ratio was unreachable; the new one is actually achieved by 14 of 20 trades. Leverage was raised because 20 trades over 4 years is a low frequency that needs amplified per-trade impact to produce a meaningful return.
- Trailing stop added: activate at +2 ATR profit, trail by 1 ATR. Out of 20 trades, 12 exited via trailing stop with average +6.21% gain. Without the trail, those mid-distance winners would have either reversed back to the initial stop or stalled below the take profit.
- ADX > 20 trend strength filter added. EMA 50/200 confirms direction but not whether the trend is actually advancing. ADX requires real directional momentum, blocking the "EMA stack looks bullish but price is chopping" environment that produced most of the original strategy's losses. Minara reported this as a separate v2 → v3 iteration so its marginal contribution could be measured independently.
- RSI threshold: > 50 → bounded 45 to 75 (long). The original accepted RSI = 85 as a buy signal. The bounded range filters out late-stage entries near overbought tops while keeping the meaningful momentum range.
## Rescue 4: Momentum Strategy → Momentum ATR Exit
The fourth target was the Momentum Strategy, a classic TradingView template: go long when 12-bar momentum is positive and accelerating, go short when both are negative. The entry logic was clean. The strategy had no exit logic at all: no stop loss, no take profit, no timed close. Positions only flipped when the opposite signal triggered. This turned every winning trend into a round-trip: the strategy rode the move up, then gave it all back waiting for the reversal to confirm. Profit factor was 1.01 over 1,165 trades, which is random. Minara's diagnosis: the entry has edge, the exit doesn't exist. The fix was four lines of code.
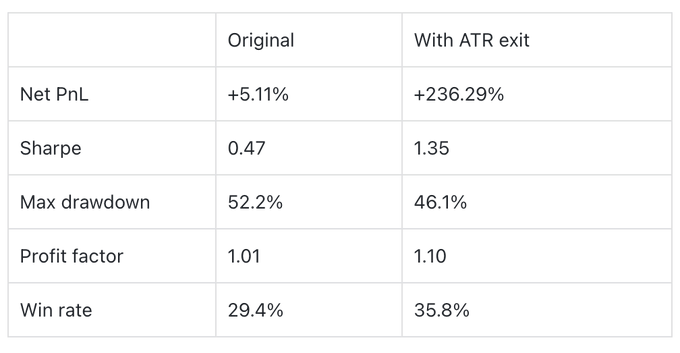
What Minara changed:
- Added ATR-scaled stop loss: 1.5 × ATR(14). Distance scales with current volatility instead of a fixed percentage.
- Added ATR-scaled take profit: 3 × ATR(14). A 2:1 reward-to-risk ratio built into every trade.
- Entry logic: unchanged. The mom0 > 0 and mom1 > 0 condition and the stop=high+mintick pending order stayed verbatim.
That was the entire change. Everything else (momentum calculation, direction, position sizing, long/short symmetry) was preserved.
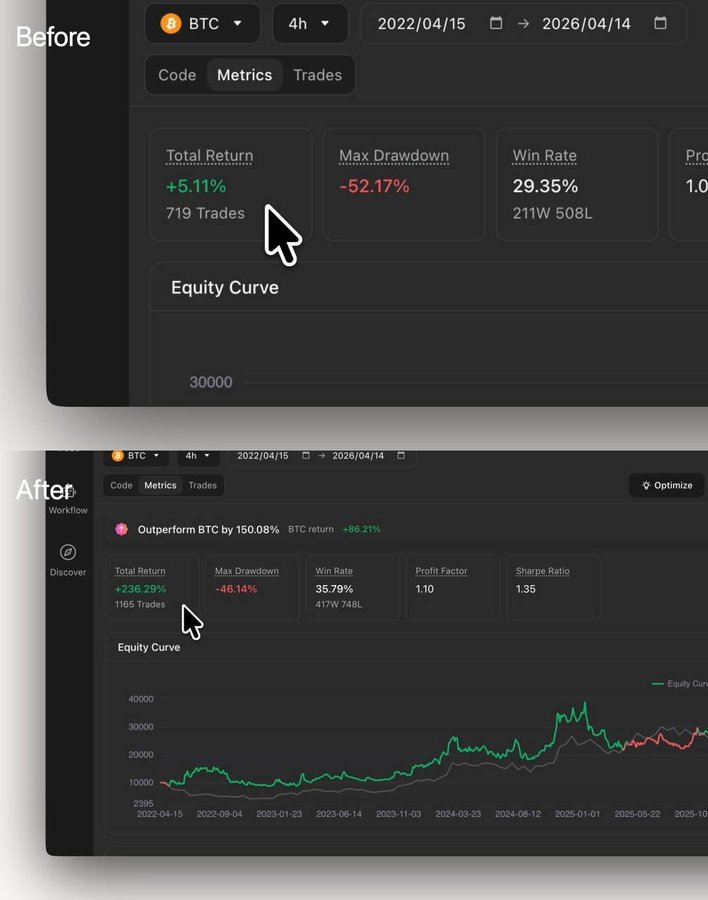
## Caveats
These findings hold under specific conditions. Several of those conditions are worth naming.
Market regime. The backtest window (2016 to 2026 for the longest timeframes, shorter for higher-frequency strategies) was net bullish for crypto. Several Tier 1 strategies are long-only trend followers that benefit directly from sustained upward drift. In a multi-year bear market, most would have different risk profiles and some would fall out of Tier 1.
Asset concentration. The aligned pool skewed toward BTC. ETH, SOL, XRP, BNB, and DOGE strategies are based on smaller samples and may not generalize. Altcoins with different volatility or liquidity profiles were not tested.
Out-of-sample validation. Only one strategy in this article (Rescue 3) was tested on data held out from the tuning process. The remaining results should be read as in-sample: strategy logic was evaluated on the same data used to identify it. The optimization cases in particular carry overfit risk that larger OOS samples would be needed to rule out.
Selection bias, quantified. We tested 236 public PineScript strategies that survived our initial screen (supported symbol, supported timeframe, sufficient kline history). Of those, only 27% passed trade-by-trade replication. Of the 63 that replicated, 57% remained profitable under HyperLiquid fees. The compound probability that a random TV strategy in our population both replicates its own backtest and makes money net of realistic fees is roughly 15%, about one in seven.
Alignment bar choice matters. Moving from ±15% PnL tolerance to trade-by-trade matching dropped our pass rate from roughly 44% to 27%. Different verification standards produce different conclusions. Anywhere in this article we report "aligned", we mean trade-by-trade. Other teams may report higher alignment rates using looser bars; we view that as noise, not signal.
Fee specificity. All real-fee numbers assume HyperLiquid's fee structure (0.015% maker, 0.045% taker). Exchanges with higher taker fees would push more strategies into Tier 3. Zero-fee environments would flip several Tier 3 results back to profitable.
Backtest vs live. These are backtests. Live execution adds latency, partial fills, and order book effects that pure OHLC replay does not capture.
## What comes next
The aligned strategy library, dual-fee backtest results, and optimization tools described in this article are all coming to Minara Strategy Studio. We are currently in internal testing. When we launch, access will open in batches starting with users already on the waitlist. ⬇️
https://minara.ai/app/trade/strategy-studio
(Click the input box to sign up.)
As more community strategies emerge, we are planning a "strategy square", where traders can share, discuss, and even earn from your own strategies. Stay tuned. 👀
## 相关链接
- [Minara AI](https://x.com/minara)
- [@minara](https://x.com/minara)
- [127K](https://x.com/minara/status/2044432012002635843/analytics)
- [Strategy Studio](https://minara.ai/app/trade/strategy-studio)
- [Optimized BTC Mean Reversion (RSI 20/65)](https://www.tradingview.com/script/pIrgsDpT/)
- [Volatility Breakout System [Fixed Risk]](https://www.tradingview.com/script/36zwwSMa/)
- [SuperTrend AI Adaptive - Strategy [BTC]](https://www.tradingview.com/script/kZVrTReu/)
- [BB Upper breakout Short +2% (dr Ziuber)](https://www.tradingview.com/script/UBGvlIlq/)
- [SuperTrend STRATEGY](https://www.tradingview.com/script/VLRj2sG9/)
- [Penguin Volatility State Strategy](https://www.tradingview.com/script/skzo4i9e/)
- [MACD Zero-Line Strategy (Long Only)](https://www.tradingview.com/script/llTXO45e/)
- [CDC BACKTEST (MACD) FIX AMOUNT $200k per trade](https://www.tradingview.com/script/7nv3hTpO/)
- [Hash Momentum Strategy](https://www.tradingview.com/script/L6VNlhiV/)
- [Moon Phases Long/Short Strategy](https://www.tradingview.com/script/sl42otOB/)
- [7/19 EMA Crypto strategy](https://www.tradingview.com/script/c0dAzn2Q/)
- [RSI > 70 Buy / Exit on Cross Below 70](https://www.tradingview.com/script/wZIdSrBG/)
- [50 & 200 SMA + RSI Average Strategy (Long Only, Single Trade)](https://www.tradingview.com/script/1x2AawHf/)
- [Kadunagra-Pivot Point SuperTrend-trades analysis](https://www.tradingview.com/script/b74KzneI/)
- [ETHUSDT 4H - Keltner Breakout](https://www.tradingview.com/script/LmNV3ZLN/)
- [Hash Supertrend [Hash Capital Research]](https://www.tradingview.com/script/6zYF9Xts/)
- [Crypto LONG PY](https://www.tradingview.com/script/3Uel153a/)
- [Oleg_Aryukov_Strategy](https://www.tradingview.com/script/R4mgYcZ5/)
- [Options test Daily Long 08:30 Exit next day 08:00 UTC](https://www.tradingview.com/script/DJT1l5tH/)
- [Qullamagi EMA Breakout Autotrade (Crypto Futures L+S)](https://www.tradingview.com/script/0rVYn2c4/)
- [Kinetic Kalman Breakout](https://www.tradingview.com/script/nd8EpyQ5/)
- [@DrZiuber](https://x.com/drziuber)
- [holdon_to_profits](https://www.tradingview.com/script/VLRj2sG9-SuperTrend-STRATEGY/)
- [Boubizee](https://www.tradingview.com/u/Boubizee/)
- [muratkbesiroglu](https://www.tradingview.com/script/1x2AawHf/)
- [antishyilma81](https://www.tradingview.com/script/J5akHbOr-XRP-Non-Stop-Strategy-TP-25-SL-15/)
- [https://minara.ai/app/trade/strategy-studio](https://minara.ai/app/trade/strategy-studio)
- [Upgrade to Premium](https://x.com/i/premium_sign_up)
- [11:05 PM · Apr 15, 2026](https://x.com/minara/status/2044432012002635843)
- [127.4K Views](https://x.com/minara/status/2044432012002635843/analytics)
- [View quotes](https://x.com/minara/status/2044432012002635843/quotes)
---
*导出时间: 2026/4/16 15:27:34*
---
## 中文翻译
# 回测236种TradingView策略后,我们发现了21台“印钞机”
**作者**: Minara AI
**日期**: 2026-04-15T15:05:50.000Z
**来源**: [https://x.com/minara/status/2044432012002635843](https://x.com/minara/status/2044432012002635843)
---

> 太长不看
> - 我们在HyperLiquid的真实手续费标准下,逐笔交易测试了236个公开的TradingView策略
> - 63个通过了严格的复制。36个盈利。21个年化收益率超过10%
> - 交易频率是手续费的主要杀手:每个从盈利转为亏损的策略每年交易超过200次
> - 低频策略几乎保留了所有优势。最好的策略:90天16笔交易,年化+204%
> - 行业标准的±15%盈亏门槛会让约103个策略通过。逐笔匹配只有63个通过。差距在于那些看起来已复制但实际并未复制的策略
> - 我们还尝试修复4个失效的策略。样本内:全部改善。样本外:有一次测试显示收益未能保持
在过去的三个月里,我们团队构建了一个流水线,用于收集公开的PineScript策略,在我们内部的Strategy Studio中重建每一个,针对TradingView自己的回测引擎逐笔复制每一笔交易,并在HyperLiquid的真实手续费结构(0.015% maker,0.045% taker)下重新运行所有内容。我们在主要币对(BTC, ETH, SOL, XRP, BNB, DOGE)和支持的时间框架上通过该流水线运行了236个策略,只有21个清除了10%的APR门槛。
本文涵盖了该流水线、总体结果,以及四个具体案例,它们讲述了从TradingView截图到实时订单簿之间发生的不同故事。
## 流水线
整个过程分四个阶段运行:

收集和筛选。我们从TradingView社区库中抓取了公开可用的PineScript v5策略,筛选出在支持的时间框架上交易主要币对(BTC, ETH, SOL, XRP, BNB, DOGE)的策略,并在Strategy Studio中重建了其中的236个。
对齐。每个策略在Strategy Studio上在相同条件下运行:与原始TradingView回测相同的资金、佣金、仓位规模和日期范围。我们在三个条件下匹配每一笔交易:方向相同,入场价格在1%以内,出场价格在1%以内。如果一个策略至少有70%的TradingView交易具有匹配的Strategy Studio交易,且总交易数量差异不超过10%(或3笔),则该策略通过对齐。236个中有63个通过:21个通过更严格的“A”级门槛(≥90%匹配,≤10%盈亏偏离),42个通过“B”级。其余173个显示出交易层面的差异,这是任何明智的参数调整都无法弥合的。
零手续费重新回测。所有63个对齐的策略在标准化窗口(1m为14天,5m为60天,15m为90天,30m为365天,1h为730天,4h和1d为1,460天)上再次运行,起始资金为10,000美元,零手续费。这将策略逻辑与执行成本隔离开来。
HyperLiquid手续费重新回测。相同的窗口,相同的资金,但挂单为0.015%,吃单为0.045%。回测引擎仅模拟手续费;实时的HyperLiquid市价单会保留额外的滑点容差,但我们不在这里建模,因为它会降低与TradingView自身报告的可比性。如果你打算实盘交易,这才是最重要的数字。
仅对齐这一步就花费了数周的调试时间。TradingView和Strategy Studio在处理K线磁铁、夏令时转换和基于合约的仓位规模方面的差异,需要对几个策略进行手动修正。总工程工作量超过了300小时。
## 数据
在63个具有近期双费回测数据的对齐策略中:
- 21个产生了超过10%的年化收益(第一梯队)
- 15个盈利但低于10% APR(第二梯队)
- 27个亏损(第三梯队)
- 57%的策略在真实手续费后保持盈利
- 手续费后的中位APR:+2.4%
- 手续费后的中位夏普比率:+0.41
(点击图片查看完整尺寸的排行榜)

这21个赚钱的策略是:
- 优化版BTC均值回归 (RSI 20/65) — BTCUSDT 15m, +204.6% APR
- 波动率突破系统 [固定风险] — ETHUSDT 1h, +124.6% APR
- SuperTrend AI自适应 - 策略 [BTC] — BTCUSDT 4h, +60.2% APR
- BB上轨突破做空 +2% (dr Ziuber) — SOLUSDT 1h, +48.1% APR
- SuperTrend 策略 — BTCUSDT 1d, +35.6% APR
- Penguin波动率状态策略 — BTCUSDT 1d, +34.5% APR
- MACD零线策略 (仅做多) — BTCUSDT 1d, +34.5% APR
- CDC回测 (MACD) 固定金额 每笔交易$200k — BTCUSDT 1d, +34.5% APR
- Hash动量策略 — BTCUSDT 4h, +32.8% APR
- 月相多空策略 — BTCUSDT 1h, +29.9% APR
- 7/19 EMA加密策略 — ETHUSDT 30m, +28.4% APR
- RSI > 70 买入 / 交叉跌破70时退出 — BTCUSDT 4h, +24.3% APR
- 50 & 200 SMA + RSI平均策略 (仅做多, 单笔交易) — ETHUSDT 1d, +23.5% APR
- Kadunagra-枢轴点SuperTrend-交易分析 — BTCUSDT 4h, +23.2% APR
- ETHUSDT 4H - Keltner突破 — ETHUSDT 4h, +21.0% APR
- Hash超级趋势 [Hash Capital Research] — SOLUSDT 4h, +15.2% APR
- 加密货币做多 PY — SOLUSDT 5m, +12.2% APR
- Oleg_Aryukov_策略 — BTCUSDT 15m, +10.9% APR
- 期权测试 每日做多 08:30 次日08:00 UTC退出 — ETHUSDT 5m, +10.8% APR
- Qullamagi EMA突破自动交易 (加密期货L+S) — ETHUSDT 1h, +10.5% APR
- 动力学卡尔曼突破 — ETHUSDT 15m, +10.1% APR
在HyperLiquid手续费下,第一梯队榜单的顶部并不是趋势追随者所期望的那样。表现最佳的是一个15分钟的优化版BTC均值回归策略,它在90天内进行了16笔交易,年化回报率为+204%,夏普比率高于4。第二名是ETH 1小时的动量策略,年化收益率为+124%。第三名是BTC 4小时的自适应SuperTrend,年化收益率为+60%。榜单的顶部混合了均值回归、动量和趋势跟踪。没有单一方法占主导地位。
榜单的中部是手续费敏感性开始显现的地方。15个第二梯队的策略都赚了钱,但微乎其微。其中许多在零手续费下本可以排在第一梯队,只有当应用了手续费时才跌至10%的门槛以下。它们的逻辑是有效的;它们的交易频率侵蚀了优势。
在分布的底部,损失加速。模式每次都是一样的:高交易量、低胜率、单笔交易利润微薄。BTC 1分钟的买卖信号是我们在该流水线的多次迭代中看到的典型例子:14天内2,655笔交易,资金亏损64.7%, extrapolates to -1,687.6% APR。它支付的手续费比它可能赚取的还要多。
该数据集中胜率非常高的策略都是以相同方式构建的:获取微小的固定利润,快速退出,重新进入。SOL 1小时的BB上轨突破做空+2%在49笔交易中达到了100%的胜率。SOL 5分钟的加密货币做多PY在39笔交易中达到了100%。BTC 1小时的OrangePulse v3.0 Lite在118笔交易中达到了94.9%的胜率。这些都是具有微小固定利润目标的均值回归策略,而它们的结构也是它们的弱点。每次获胜的金额都很小,而往返手续费却消耗固定的0.06%。当平均获胜交易利润为1.5%时,在其他因素之前,手续费就消耗了大约4%的优势。OrangePulse以+0.1%的APR幸存下来。列表中的下一个策略则没有。

相反的情况在纸面上看起来更糟,但在实践中表现更好。BTC 4小时的RSI > 70买入的胜率在35%左右。它几乎每三笔交易中就输掉两笔。SuperTrend AI自适应的胜率在48%左右。Keltner突破在34%左右。这些是趋势跟踪策略,大多数交易亏损一点,少数交易赚很多。偶尔的大赢家毫不费力地吸收了手续费成本。按手续费后的年化回报计算,大多数第一梯队的策略胜率在35%到50%之间。低胜率配以高利润因子是能够幸存的特征。
BTC 1d的SuperTrend策略是一个第一梯队的佼佼者,在其4笔交易的历史中,面临着46.1%的最大回撤。RSI > 70买入也以14.8%的最大回撤和高于2的夏普比率进入了第一梯队。忍受46%的回撤与忍受15%的回撤是不同的体验,即使期末的最终数字更大。
夏普比率对数据集的排序与原始APR不同。第一梯队中最高的夏普比率属于一个15分钟的均值回归策略,它在短窗口内进行了非常少的交易。RSI > 70买入和SuperTrend AI自适应在风险调整指标方面也接近顶部。低APR配上可控的回撤和高夏普比率,可能比需要先在濒临破产中幸存的高APR更具可交易性。

利润因子讲述了一个相关的故事。SuperTrend的8.98意味着其总利润几乎是总损失的9倍。这个比率解释了为什么四笔交易就足以排在第一梯队。其他第一梯队策略的优势来自许多较小的胜利,单笔交易利润分布在几十或几百个仓位中。两者都有效。它们的工作方式不同。
第一梯队榜单的顶部混合了均值回归、动量和趋势跟踪。复杂的多因子系统和简单的单参数策略都出现了。复杂性和简单性都不能在63个策略中始终预测回报。能够预测回报的是策略的单笔交易特征与其交易的手续费环境之间的匹配。没有指标或过滤器组合主导第一梯队:趋势跟踪出现得最频繁,但布林带、Keltner通道、EMA交叉、MACD和基于日历的入场都产生了第一梯队的成员。

手续费影响的主要驱动因素不是策略类型、资产或时间框架。而是交易数量。在分析池的63个策略中,14个在零手续费时是盈利的,一旦应用HyperLiquid手续费就亏损了。这14个策略中的每一个每年交易超过200次。每年交易少于25次的策略几乎保留了其所有的零手续费收益。
这些策略倾向于趋势跟踪,最常见的时间框架是4小时和日线。BTC是交易最多的资产,但该池还包括ETH、SOL、XRP、BNB和DOGE策略。
上述总体数据将63个策略扁平化为平均值和梯队。下面的四个案例打破了平均值:一个胜率为100%的均值回归做空,一个在四年内触发四次的趋势追随者,一个买入超买状况的动量玩法,以及一个击败亏损市场的经典移动平均策略。每一个在纸面上看起来都是错误的。每一个都有效。
(以下所有案例均在Strategy Studio的内部测试版本中运行。要申请早期访问,请参阅本文末尾的链接。)
## 案例1:胜率100%的做空策略,BB Upper Breakout Short +2% by @DrZiuber, SOLUSDT, 1h

当价格突破布林带上轨(20周期,2个标准差)上方2%时,该策略做空SOL,并在2%的利润时退出。这是一个教科书式的均值回归玩法:当资产飙升到近期范围之外时,卖出它并等待回调。
在730天内,它进行了49笔交易。每一笔都是盈利的。胜率:100%。
在HyperLiquid手续费下,它总共回报了+96.3%,或年化+48.1%。手续费拖累仅为3%,几乎微不足道,因为该策略交易不频繁,并且在每个仓位上都获得了可观的利润。
对齐检查是干净的:Strategy Studio与TradingView的结果在2%以内匹配,交易数量相同。
有明显的警告。两年内的49笔交易是一个小样本。该策略仅适用于SOL,SOL在此期间具有特定的波动性特征。49笔交易100%的胜率并不意味着接下来49笔交易也是100%胜率。而且最大回撤是36.7%,这意味着在某一时刻,该策略坐在显著的未实现亏损上,直到回归完成。警告是真实的。优势也是真实的。

## 案例2:四年四笔交易,SuperTrend STRATEGY by holdon_to_profits, BTCUSDT, 1d

大多数策略试图捕捉尽可能多的变动。这个策略恰恰相反。它在BTC日线蜡烛图上运行经典的SuperTrend指标(ATR周期10,倍数8.5),当趋势转为看涨时做多。高倍数意味着它几乎忽略所有东西。只有主要的趋势反转才会触发信号。
在四年(1,460天)内,它进行了四笔交易。三笔是赢家,一笔是输家。HyperLiquid手续费下的总回报:+292.4%,或年化+73.1%。
手续费拖累是1%。四年内四笔交易意味着该策略总共支付了八次手续费(入场和出场)。在HyperLiquid的手续费结构下,该成本实际上无关紧要。
夏普比率是1.24。利润因子是8.98。最大回撤是46.1%,这很大但在意料之中。当你在没有止损的情况下通过趋势反转持有BTC时,你会 ride the drawdown 直到SuperTrend翻转。
即使涵盖四年的日线蜡烛,四笔交易也是一个很小的样本。8.98的利润因子对于测试期间是准确的;围绕该数字的置信区间很宽。排名是真实的。这在一定程度上也是在有利窗口上窄交易数量的产物。
与TradingView的对齐很紧密:7%的盈亏偏离,相同的交易数量(TV回测窗口期间7笔交易),相同的胜率。
具有高倍数的SuperTrend几乎算不上一个策略。它更接近“当BTC开始牛市时买入,结束时卖出”。在我们测试的37个策略中,34个使用了更多的信号、更多的过滤器和更多的逻辑。这个只使用了ATR和一个倍数。它排名第二。

## 案例3:买入超买,RSI > 70 Buy / Exit on Cross Below 70 by Boubizee, BTCUSDT, 4h

每个初学者都学过同样的规则:RSI高于70意味着超买,是时候卖出了。这个策略恰恰相反。当RSI(14)向上穿过70时买入BTC,当RSI回落至70以下时退出。这是一个动量延续玩法:假设是强劲的RSI读数表明力量,而不是衰竭。
在1,460天内,它进行了142笔交易。胜率:35.2%。在HyperLiquid手续费下,它总共回报了+99.7%,或年化+24.9%。
夏普比率是1.85。最大回撤是14.8%。年化+24.9%且回撤14.8%,这是一个比我们数据集中大多数名义APR回报更高的策略更好的风险调整特征。
手续费拖累是21%,有意义但不会失去资格。在四年内142笔交易,每笔交易的往返成本平均约为0.06%。单笔交易的优势足够大,可以幸存下来。
对齐是干净的:与TradingView的盈亏偏离为2%,交易数量匹配。
指标阈值是启发式的,不是定律。在BTC 4小时上,四年和142笔交易中,RSI高于70往往更多意味着动量而不是衰竭。

## 案例4:击败亏损市场,50 & 200 SMA + RSI Average Strategy by muratkbesiroglu, ETHUSDT, 1d

该策略使用了趋势跟踪中最古老的想法之一:当价格位于50日和200日SMA之上,并且平滑RSI(RSI-21的9周期平均值)高于57时做多。当价格跌破50日SMA且RSI平均值回落至57以下时退出。仅做多,一次一个仓位,无杠杆。
在测试窗口内,它进行了19笔交易。在HyperLiquid手续费下,它回报了+95.1%,而ETH的buy-and-hold回报了-22.1%。在仅仅持有ETH就亏钱的时期,该策略跑赢了市场117个百分点。
夏普比率是1.16。该策略在大多数横盘和下跌期间保持在市场之外,这就是为什么它以如此大的幅度跑赢了buy-and-hold:57阈值的RSI过滤器迫使它在拖累长期持有者的低动量条件下持有现金。
对齐检查几乎是完美的:19笔交易全部匹配TradingView的引擎,盈亏在0.1个百分点以内(TV测试窗口内1,072.0% vs 1,071.9%)。
本文中的大多数策略在buy-and-hold表现良好的时期击败了buy-and-hold。这一个在buy-and-hold亏损的时期击败了buy-and-hold。这是一种不同类型的测试,也是更难的一种。教科书式的答案仍然有效;在疲软时期避开市场的纪律才是使其有效的原因。

## 优化
这四个案例从不同角度指向了相同的模式。使它们起作用的不是指标选择、胜率或复杂性。而是单笔交易优势与手续费成本之间的匹配:每个策略要么交易频率足够低以保留其优势,要么获得的利润足够大以吸收往返成本。BTC 1d的SuperTrend在四年内支付了八次手续费。SOL的均值回归做空在730天内进行了49笔交易。RSI延续玩法每三笔交易只赢一笔,但赢家的利润足够大,手续费几乎可以忽略不计。SMA策略的优势不在于它交易了什么,而在于它跳过了什么:RSI过滤器使其在拖累长期持有者的时期持有现金。
复制是Minara所做的其中一件事。下面的四个案例展示了另一件事:从数据集的失败端选取一个策略,识别结构上有什么问题,并修复它。修复范围从四行补丁到完全重写,并非所有修复都在样本外数据中站得住脚。这些是我们在测试期间遇到的典型优化案例。
## 拯救1:买卖信号策略 → Quant Trend Engine风格逻辑(完全重写)
第一个目标是买卖信号策略,这是一个1分钟的BTC剥头皮策略,在14天内进行了2,655笔交易,在HyperLiquid手续费下亏损了其资本的64.7%。Minara拒绝调整该策略,而是从头开始重写,借鉴了我们数据集中高分模板的结构元素。结果是一个4小时的多因子趋势追随者,在结构上与原始的EMA交叉逻辑无关。

Minara改变了什么:
- 时间框架:1m → 4h。1分钟窗口在14天内产生了2,655笔交易。4小时窗口每年产生大约18笔交易。为了幸存于手续费所需的单笔交易优势从不可能的0.09%+下降到了可达到的0.2到0.5%。
- 入场:单一EMA交叉 → 8因子加权评分。重写要求在EMA堆叠、斜率、分离度、动量持久性、路径效率、突破强度、ATR制度和回调reclaim方面获得最低5.0分。没有一个单一因素可以单独触发入场。
- 添加了路径效率过滤器。Kaufman效率比率 ≥ 0.33。这个单一过滤器在横盘市场期间阻止入场,原始策略在那里积累了大部分损失。
- 止损:0.5 ATR固定 → 2%硬止损 + 2.8 ATR移动止损。1分钟上的紧ATR止损被噪音吞噬。移动止损给真正的趋势留出了运行空间。
- 方向:多 & 空 → 仅做多。BTC的长期beta是正的。做空一个结构上向上漂移的资产会在任何策略逻辑应用之前放弃优势。
- 出场后5根K线冷却。防止重新进入刚刚触发前一个止损的相同噪音模式。

Minara没有发明这种结构。它选择了一个类似于Quant Trend Engine的骨架,该引擎已经是我们要数据集中的顶级表现者,并针对原始策略的资产进行了调整。诊断一个策略在结构上是否无法挽救并提出一个已知良好的替代方案,比假装参数调整会起作用更有用。
## 拯救2:XRP Non-Stop Strategy by antishyilma81 → XRP Trailing ATR
第二个目标是XRP Non-Stop Strategy,这是一个仅做多的趋势追随者,使用EMA 20/50过滤,固定25%止盈和15%止损。在730天内,它回报了+26.2%的PnL,胜率为43.8%。问题不是名义回报。问题是75.7%的最大回撤和1.04的利润因子,这意味着该策略之所以幸存,仅仅是因为一次最终的胜利恰好抵消了累积的损失。Minara保留了骨架(EMA过滤器,仅做多,25%止盈,XRP代码守护),并在其周围添加了四个模块。

Minara改变了什么:
- 止损:固定15% → 2.5 ATR初始,2.0 ATR移动,仅棘轮。固定15%在高波动制度下要么太紧,在低波动制度下要么太松,并且它对未实现收益没有提供保护。ATR移动止损随着价格推进锁定利润。这一单一变化占回撤从75.7%减少到14.6%的大部分。
- RSI入场过滤器:要求RSI < 45。反直觉地严格。随着EMA已经确认上升趋势,只有当RSI下跌时才会触发入场,买入回调而不是突破。胜率从43.8%上升到55.8%。
- ATR制度过滤器:当ATR/价格 < 1.5%时跳过。低波动窗口产生假的EMA交叉和被刮掉的紧密止损。阻止这些窗口将利润因子从1.04提高到2.99。
- 出场后3根K线冷却。防止重新进入刚刚触发止损的相同震荡模式。

该策略交易更多,但单笔交易质量更高。Minara还报告了它测试并拒绝的四个替代方案:更紧的1.5 ATR移动止损被正常的回调刮掉,较短的EMA产生更多的假交叉,更近的15%止盈限制了赢家并导致利润因子崩溃,8根K线冷却错过了延续入场。被拒绝的分支与被接受的变更一样定义了参数空间。
## 拯救3:EMA 50/200 Pullback + RSI (BTC/USDT 15m - 2 Bar Logic)
第三个目标是BTC 15m上的EMA 50/200 Pullback策略,该策略使用2根K线的回调并回收信号,固定0.49%止损和1:5回报比。骨架是合理的。执行规模是错误的:15m上的0.49%止损位于正常噪音内部,而1:5回报比在纸面上看起来很吸引人,但在实践中是无法达到的,因为大多数交易在达到目标之前止损。Minara更改了时间框架,替换了风险模型,添加了趋势过滤器,添加了移动止损,并收紧了入场条件。
样本内结果(2022-04至2025-01,2.8年):

Minara改变了什么:
- 时间框架:15m → 1D。15m上的0.49%止损大约是0.16 ATR(在正常噪音内部)。在日线上,相同的百分比约为~0.5 ATR(一个有意义的变动)。回调并回收信号也从一个微观结构事件转变为一个跨越两天的结构性事件。
- 风险模型:固定0.49% / 2.45% at 1x → ATR缩放1.5 / 4.0 at 20x杠杆。风险回报从纸面上的1:5下降到实际的1:2.63。原始比率是无法达到的;新比率实际上由20笔交易中的14笔实现。杠杆被提高了,因为四年内的20笔交易是一个低频率,需要放大的单笔交易影响才能产生有意义的回报。
- 添加了移动止损:在+2 ATR利润时激活,追踪1 ATR。在20笔交易中,12笔通过移动止损退出,平均+6.21%收益。如果没有移动止损,这些中等距离的赢家要么会逆转回初始止损,要么会在止盈以下停滞。
- 添加了ADX > 20趋势强度过滤器。EMA 50/200确认方向但不确认趋势是否实际推进。ADX需要真实的方向动量,阻止“EMA堆叠看起来看涨但价格在震荡”的环境,该环境产生了原始策略的大部分损失。Minara将其报告为单独的v2 → v3迭代,因此可以独立测量其边际贡献。
- RSI阈值:> 50 → 有界45至75(做多)。原始接受RSI = 85作为买入信号。有界范围过滤掉接近超买顶部的晚期入场,同时保持有意义的动量范围。

## 拯救4:动量策略 → 动量ATR出场
第四个目标是动量策略,一个经典的TradingView模板:当12根K线动量为正并在加速时做多,当两者都为负时做空。入场逻辑是干净的。该策略根本没有出场逻辑:没有止损,没有止盈,没有定时收盘。只有当相反的信号触发时,仓位才会翻转。这把每一个获胜的趋势都变成了一个往返:策略骑乘上涨,然后在等待反转确认时全部回吐。利润因子在1,165笔交易中为1.01,这是随机的。Minara的诊断:入场有优势,出场不存在。修复是四行代码。

Minara改变了什么:
- 添加了ATR缩放止损:1.5 × ATR(14)。距离随当前波动率缩放,而不是固定百分比。
- 添加了ATR缩放止盈:3 × ATR(14)。每笔交易内置2:1的回报风险比。
- 入场逻辑:未改变。mom0 > 0和mom1 > 0条件以及stop=high+mintick挂单保持原样。
这就是整个变化。其他所有内容(动量计算、方向、仓位规模、多/空对称性)都被保留了。

## 注意事项
这些发现是在特定条件下成立的。其中几个条件值得指出。
市场制度。回测窗口(最长时间框架为2016年至2026年,较高频率策略则较短)对加密货币来说是净看涨的。几个第一梯队的策略是仅做多的趋势追随者,直接受益于持续的上行漂移。在长达数年的熊市中,大多数将有不同的风险特征,有些将跌出第一梯队。
资产集中度。对齐池偏向BTC。ETH、SOL、XRP、BNB和DOGE策略基于较小的样本,可能不会泛化。具有不同波动性或流动性特征的替代币未经过测试。
样本外验证。本文中只有一个策略(拯救3)在从调整过程中保留的数据上进行了测试。其余结果应视为样本内:策略逻辑在与识别它相同的数据上进行评估。特别是优化案例存在过拟合风险,需要更大的OOS样本来排除。
选择偏差,量化。我们测试了236个公开的PineScript策略,这些策略在我们的初步筛选(支持的代码、支持的时间框架、足够的K线历史)中幸存下来。其中,只有27%通过了逐笔复制。在复制的63个中,57%在HyperLiquid手续费下保持盈利。在我们总体中,一个随机TV策略既复制其自己的回测又在扣除实际手续费后赚钱的复合概率约为15%,大约七分之一。
对齐门槛选择很重要。从±15% PnL容差移动到逐笔匹配将我们的通过率从大约44%降至27%。不同的验证标准产生不同的结论。在本文中,我们报告“对齐”,我们的意思是逐笔交易。其他团队可能使用较宽松的门槛报告较高的对齐率;我们将其视为噪音,而不是信号。
手续费特异性。所有真实手续费数字都假设HyperLiquid的手续费结构(0.015% maker,0.045% taker)。具有较高taker手续费的交易所将把更多策略推入第三梯队。零手续费环境将把几个第三梯队的结果翻转回盈利。
回测与实盘。这些是回测。实时执行增加了纯OHLC重放无法捕获的延迟、部分成交和订单簿效应。
## 接下来是什么
本文描述的对齐策略库、双费回测结果和优化工具都将进入Minara Strategy Studio。我们目前正在内部测试。当我们发布时,访问将分批开放,从已经在候补名单上的用户开始。 ⬇️
https://minara.ai/app/trade/strategy-studio
(点击输入框注册。)
随着更多社区策略的出现,我们正在规划一个“策略广场”,交易者可以在其中分享、讨论,甚至从您自己的策略中获利。敬请期待。 👀
## 相关链接
- [Minara AI](https://x.com/minara)
- [@minara](https://x.com/minara)
- [127K](https://x.com/minara/status/2044432012002635843/analytics)
- [Strategy Studio](https://minara.ai/app/trade/strategy-studio)
- [Optimized BTC Mean Reversion (RSI 20/65)](https://www.tradingview.com/script/pIrgsDpT/)
- [Volatility Breakout System [Fixed Risk]](https://www.tradingview.com/script/36zwwSMa/)
- [SuperTrend AI Adaptive - Strategy [BTC]](https://www.tradingview.com/script/kZVrTReu/)
- [BB Upper breakout Short +2% (dr Ziuber)](https://www.tradingview.com/script/UBGvlIlq/)
- [SuperTrend STRATEGY](https://www.tradingview.com/script/VLRj2sG9/)
- [Penguin Volatility State Strategy](https://www.tradingview.com/script/skzo4i9e/)
- [MACD Zero-Line Strategy (Long Only)](https://www.tradingview.com/script/llTXO45e/)
- [CDC BACKTEST (MACD) FIX AMOUNT $200k per trade](https://www.tradingview.com/script/7nv3hTpO/)
- [Hash Momentum Strategy](https://www.tradingview.com/script/L6VNlhiV/)
- [Moon Phases Long/Short Strategy](https://www.tradingview.com/script/sl42otOB/)
- [7/19 EMA Crypto strategy](https://www.tradingview.com/script/c0dAzn2Q/)
- [RSI > 70 Buy / Exit on Cross Below 70](https://www.tradingview.com/script/wZIdSrBG/)
- [50 & 200 SMA + RSI Average Strategy (Long Only, Single Trade)](https://www.tradingview.com/script/1x2AawHf/)
- [Kadunagra-Pivot Point SuperTrend-trades analysis](https://www.tradingview.com/script/b74KzneI/)
- [ETHUSDT 4H - Keltner Breakout](https://www.tradingview.com/script/LmNV3ZLN/)
- [Hash Supertrend [Hash Capital Research]](https://www.tradingview.com/script/6zYF9Xts/)
- [Crypto LONG PY](https://www.tradingview.com/script/3Uel153a/)
- [Oleg_Aryukov_Strategy](https://www.tradingview.com/script/R4mgYcZ5/)
- [Options test Daily Long 08:30 Exit next day 08:00 UTC](https://www.tradingview.com/script/DJT1l5tH/)
- [Qullamagi EMA Breakout Autotrade (Crypto Futures L+S)](https://www.tradingview.com/script/0rVYn2c4/)
- [Kinetic Kalman Breakout](https://www.tradingview.com/script/nd8EpyQ5/)
- [@DrZiuber](https://x.com/drziuber)
- [holdon_to_profits](https://www.tradingview.com/script/VLRj2sG9-SuperTrend-STRATEGY/)
- [Boubizee](https://www.tradingview.com/u/Boubizee/)
- [muratkbesiroglu](https://www.tradingview.com/script/1x2AawHf/)
- [antishyilma81](https://www.tradingview.com/script/J5akHbOr-XRP-Non-Stop-Strategy-TP-25-SL-15/)
- [https://minara.ai/app/trade/strategy-studio](https://minara.ai/app/trade/strategy-studio)
- [Upgrade to Premium](https://x.com/i/premium_sign_up)
- [11:05 PM · Apr 15, 2026](https://x.com/minara/status/2044432012002635843)
- [127.4K Views](https://x.com/minara/status/2044432012002635843/analytics)
- [View quotes](https://x.com/minara/status/2044432012002635843/quotes)
---
*导出时间: 2026/4/16 15:27:34*