# Everything Is Connected
**作者**: 𝗿𝗮𝗺𝗮𝗸𝗿𝘂𝘀𝗵𝗻𝗮— 𝗲/𝗮𝗰𝗰
**日期**: 2026-04-11T11:52:58.000Z
**来源**: [https://x.com/techwith_ram/status/2042933925832724538](https://x.com/techwith_ram/status/2042933925832724538)
---
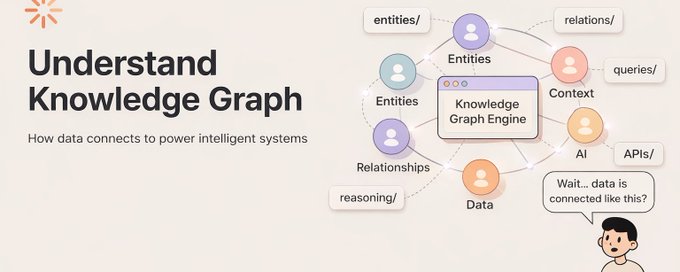
I think the title is a bit philosophical. Isn't it?
Don't worry, you will get it at the end. So, imagine a scene: you are standing in a bookshop. You pick up a novel. On the cover it says the author's name. You happen to know that author also teaches at a university in your city. That university is located near a park where there is a statue of a poet who was a contemporary of a character in the very novel you are holding.
You made five connections in a few seconds, entirely without effort. This is how human knowledge actually works. It does not live in isolated boxes. It is a dense, tangled network of associations, and our brains are extraordinarily good at navigating it.
The question is, how do we teach a computer to do the same thing?
Why do traditional databases fall short?
Traditional relational databases organize information into tables: rows and columns. A library database might have a Books table, an Authors table, and a Publishers table. To connect them, you write a JOIN query; you tell the system, "Match the author_id in Books with the id in Authors."
This works wonderfully for a fixed, predictable set of relationships. But it breaks down when:
- Relationships vary per entity: A book has an author. But a scientific paper has co-authors, an institution, a funding body, and a dataset. These cannot all live comfortably in the same table structure.
- The schema changes constantly: In a traditional database, adding a new type of relationship often requires restructuring the entire schema. In a graph, you simply add a new edge type.
- Traversing many hops is expensive: Finding "all books written by authors who studied under professors who won the same prize" requires multiple nested joins. In a graph, this is a natural path traversal.
## What is a knowledge graph?
It is a structured representation of real-world entities & the relationships between them, stored as a network (or graph) rather than a table.
It consists of:
- Nodes (also called vertices or entities) These represent things: a person, a city, a concept, a product, a chemical compound. Each node has a unique identity.
- Edges (also called relationships or predicates) These connect two nodes and describe the nature of their connection. Edges are always directed and always labeled. "Marie Curie BORN_IN Warsaw" is a different fact from "Warsaw BORN_IN Marie Curie"—direction matters.
- Properties (also called attributes or literals) Both nodes and edges can carry additional data: a person node might have a birth year property; a "WORKED_AT" edge might carry a start and end date.
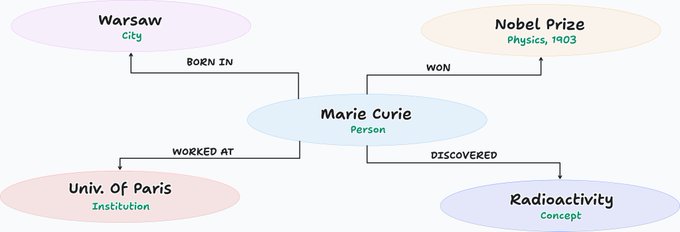
Designed by author: @techwith_ram
## The triple: the smallest unit of knowledge
The fundamental building block of a knowledge graph is the triple: a statement made of three parts.
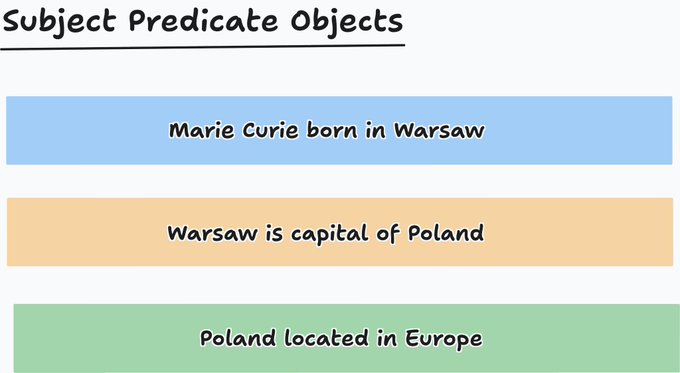
Designed by author: @techwith.ram
Three sentences. Eleven words. And from them, a machine can already infer that Marie Curie was born in the capital of a European country. That kind of chained reasoning is the superpower of the knowledge graph.
## Building a Knowledge Graph
A real-world example: a city neighbourhood
Let us build a small knowledge graph together. Imagine we want to represent the knowledge contained in this single paragraph:
> The Blue Door is a cafe on Elm Street. It is owned by Ramakrushna, who also owns the bakery next door called Morning Light. The Blue Door is known for its Ethiopian coffee, which is sourced from the Yirgacheffe region. Morning Light supplies pastries to three local hotels, including the Grand Elm.
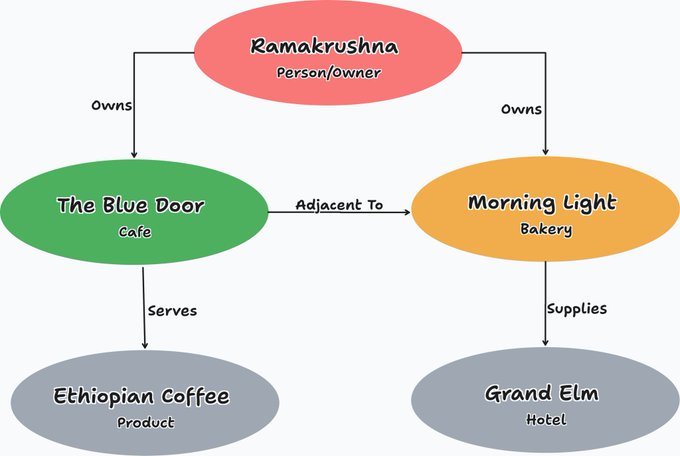
Designed by Author: @techwith_ram
Notice something important: once this graph exists, questions that were never explicitly answered in the original text become answerable. For example: "Is Ramakrushna connected to the Grand Elm Hotel?" The text never says so directly, but the graph reveals the path: Ramakrushna owns Morning Light, and Morning Light supplies the Grand Elm. Two hops. One answer.
## Ontology: the grammar of your graph
A knowledge graph without an ontology is like a library without a cataloguing system. Ontology is the formal description of what kinds of things exist in your domain and what kinds of relationships are possible between them.
Think of it as the rules of the game. An ontology might say, "In our graph, a Person can OWN a Business, but a City cannot." This prevents nonsense from entering your data.
## Classes and instances
In an ontology, we distinguish between classes (categories of things) and instances (specific things). "Person" is a class. "Marie Curie" is an instance of that class. "City" is a class. "Warsaw" is an instance. This distinction lets us write rules at the class level that apply to every instance automatically.
Adding context with named graphs:
Sometimes a single fact is not enough. You need to say when something was true, or according to whom. This is done using named graphs essentially, a wrapper around a set of triples that adds provenance and temporal context.
> APJ Abdul Kalam President of India.
... is only valid from 2002 to 2007. The context provides the time range.
Without this temporal layer, your graph would assert things that are no longer true, with no way to distinguish current facts from historical ones.
## Querying the Graph
The real power of a knowledge graph emerges when you query it. Instead of asking, "Give me row 47 from this table," you ask questions that follow chains of relationships. Questions like:
"Find all scientists who were born in Europe and won a Nobel Prize in a natural science discipline." This traverses BORN_IN, LOCATED_IN, WON, and FIELD_OF edges in a single query.
Which products are manufactured by companies owned by someone who also serves on the board of our company? ". This is a 4-hop traversal that would require multiple joins in SQL but is natural in a graph query language like SPARQL or Cypher.
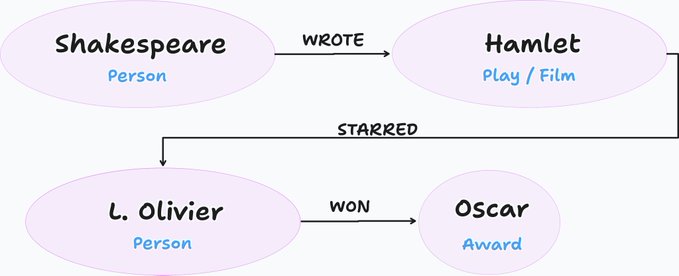
Designed by author: @techwith_ram
Path query: Shakespeare -- [2 hops] -- Academy Award
Perhaps the most intellectually satisfying feature of knowledge graphs is inference: the ability to derive new facts that were never explicitly stored, purely by applying logical rules to what is already there.
A simple example
Suppose your graph contains these two facts:
Anna is parent of Ben
Ben is parent of Clara
You have also defined an ontology rule: "If X is parent of Y, and Y is parent of Z, then X is grandparent of Z."
The graph can now be derived without you explicitly adding it:
Anna is the grandparent of Clara
Scale this idea to millions of facts and hundreds of rules, and you have a system that can surface knowledge that no human explicitly put there.
I'm someone who works in the healthcare sector; let me give you an example from there:
> A medical knowledge graph might store "Drug A inhibits Enzyme B" and "Enzyme B is required for the synthesis of Protein C, which is overexpressed in Cancer D." From these two facts, inference can automatically suggest that Drug A may be a candidate treatment for Cancer D, even if no researcher has yet made that explicit connection.
## Knowledge Graphs vs Other Data Models
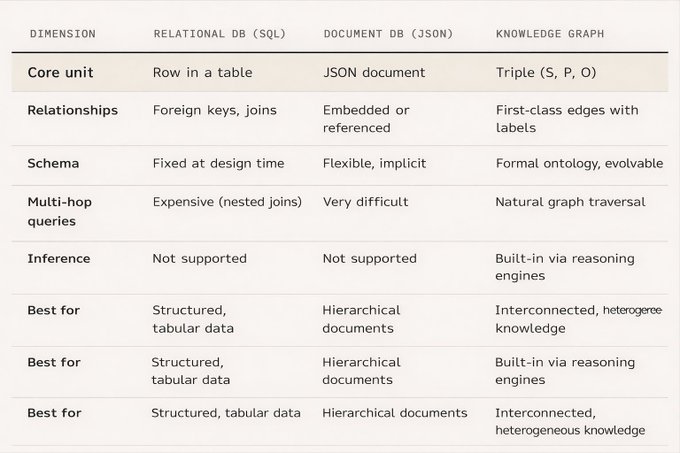
AI Generated by @techwith_ram
When should you choose a knowledge graph?
KG is not always the right tool. It shines in specific situations. Here is a simple rule: if the relationships between your data are as important as the data itself, consider a knowledge graph.
Use a knowledge graph when ::: Your data comes from many heterogeneous sources. Your schema evolves frequently. You need to traverse chains of relationships. You want to derive new facts by reasoning over existing ones.
Stick with a relational database when ::: Your data is highly tabular and stable. Your queries are simple lookups or aggregations. You need transactional guarantees (ACID) above all else. Your team is SQL-proficient, and your data fits the table model cleanly.
So have you heard about Google Knowledge Graph?
Google Knowledge Graph
The most famous knowledge graph in the world is the one built by Google. Launched in 2012, it powers the information boxes you see on the right side of search results, those cards that tell you who a person is, what they are known for, where they were born, and what other entities are related to them.
When you search for "Albert Einstein," Google does not just find web pages containing that string. It retrieves a structured entity, a node in a graph that carries facts about Einstein and links him to other entities: his theories, his university, his colleagues, his era.
I mean, if you will hear the scale of it, you will be shocked.
It is estimated to contain tens of billions of facts across hundreds of millions of entities. It underpins not just search results, but also Google Assistant, Google Maps, and an increasing number of AI features.
Some of the most consequential knowledge graphs are invisible to the public. In biomedical research, knowledge graphs are used to integrate data from:
- Drug databases: Chemical structures, mechanisms of action, side effects, interactions.
- Genomic databases: Gene-disease associations, protein functions, pathways.
- Clinical literature Published research on treatment outcomes and case studies.
By connecting these sources in a single graph, researchers can identify unexpected drug repurposing opportunities, predict adverse drug interactions, and understand disease mechanisms that span multiple biological layers.
How Does an Enterprise Knowledge Graph Work?
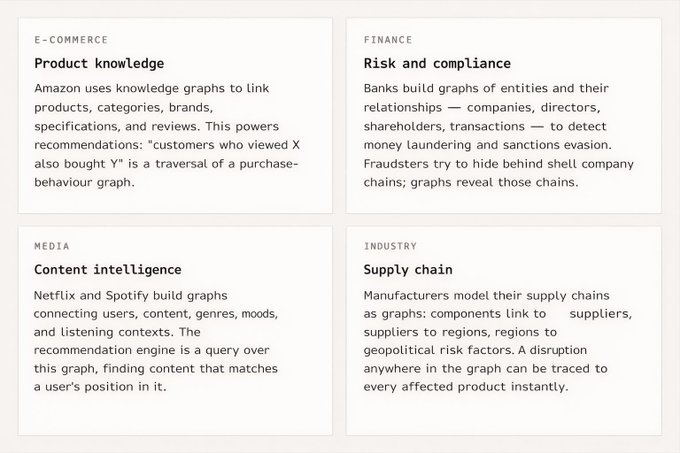
AI Generated by @techwith_ram
Final Thought
Knowledge graphs are powerful, but they are not magic. Understanding their limitations is as important as understanding their strengths.
No knowledge graph is complete. Wikidata, one of the largest public knowledge graphs, has millions of entities but enormous gaps; most people, places, and events in history are not represented or are represented incompletely.
More dangerously, knowledge graphs can contain incorrect facts. If the data source was wrong, or if the extraction process misread a piece of text, the graph will confidently assert something false. And because inference can propagate that error through the graph, one bad fact can corrupt many derived conclusions.
Hope you like the article; comment on what you feel or if you want to share something.
Follow @techwith_ram for more such posts.
## 相关链接
- [𝗿𝗮𝗺𝗮𝗸𝗿𝘂𝘀𝗵𝗻𝗮— 𝗲/𝗮𝗰𝗰](https://x.com/techwith_ram)
- [@techwith_ram](https://x.com/techwith_ram)
- [17K](https://x.com/techwith_ram/status/2042933925832724538/analytics)
- [@techwith_ram](https://x.com/@techwith_ram)
- [@techwith](https://x.com/@techwith)
- [@techwith_ram](https://x.com/@techwith_ram)
- [@techwith_ram](https://x.com/@techwith_ram)
- [@techwith_ram](https://x.com/@techwith_ram)
- [@techwith_ram](https://x.com/@techwith_ram)
- [@techwith_ram](https://x.com/@techwith_ram)
- [Upgrade to Premium](https://x.com/i/premium_sign_up)
- [7:52 PM · Apr 11, 2026](https://x.com/techwith_ram/status/2042933925832724538)
- [17.9K Views](https://x.com/techwith_ram/status/2042933925832724538/analytics)
- [View quotes](https://x.com/techwith_ram/status/2042933925832724538/quotes)
---
*导出时间: 2026/4/12 22:37:59*